Fig. 8.
Download original image
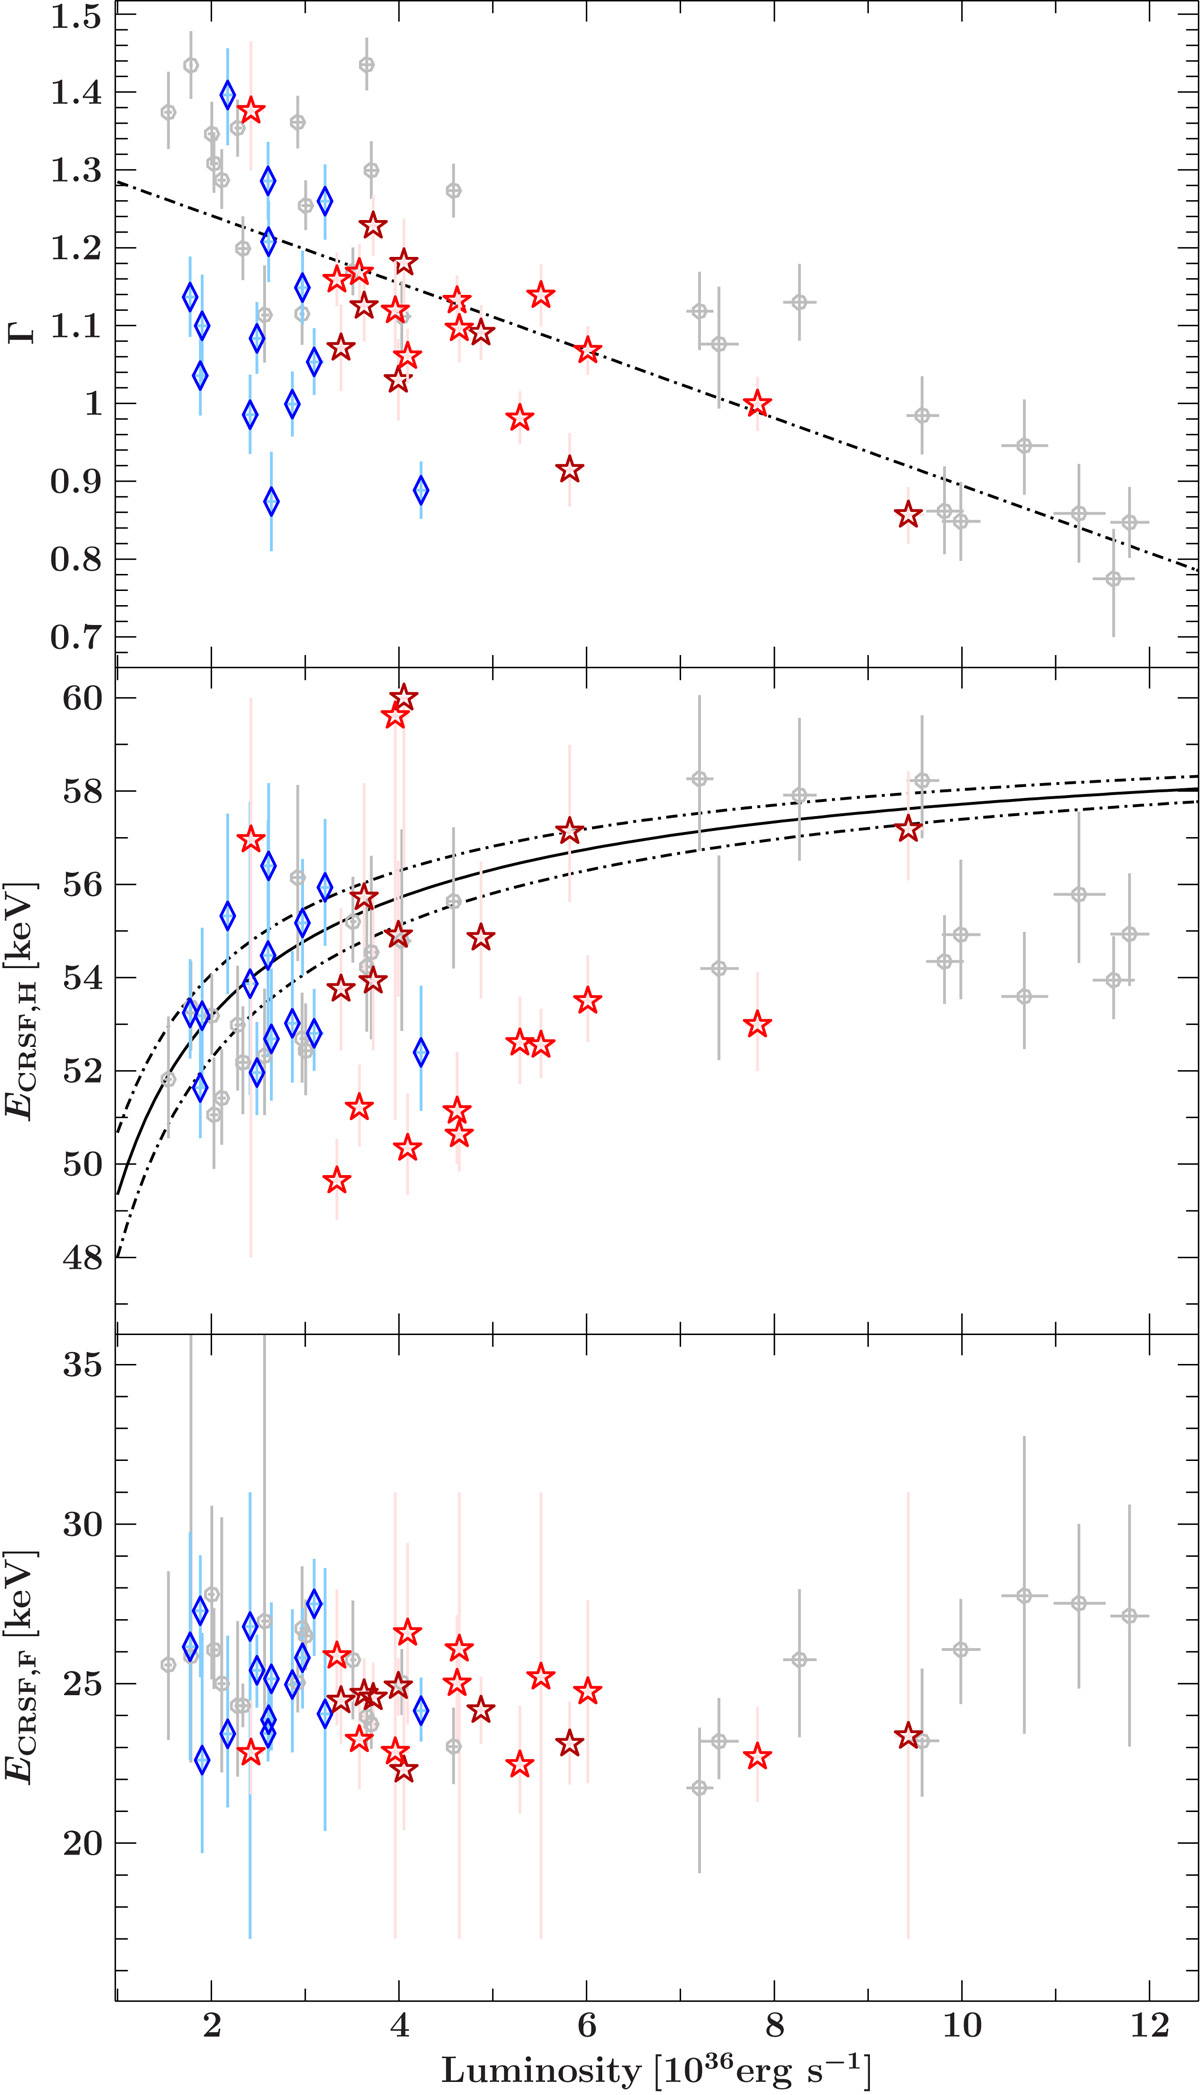
Spectral parameter as a function of the 3–79 keV luminosity based on our orbit-by-orbit spectroscopy results (dark blue diamonds represent observation I, bright red stars observation IIa, and dark red stars observation IIb) together with kilosecond-integrated spectral fits from Fig. 7 in Fürst et al. (2014b) (grey circles). Upper panel: photon index (Γ). The dot-dashed black line is a linear regression through all data points, meant to guide the eye. Middle panel: energy of the harmonic CRSF (ECRSF, H). The solid black line is the theoretical prediction for Λ = 1, ENS = 30 keV, and MNS = 1.9 M⊙. The dot-dashed lines above and below the solid line are for MNS = 1.7 M⊙ and MNS = 2.1 M⊙, respectively. Lower panel: energy of the fundamental line (ECRSF, F).
Current usage metrics show cumulative count of Article Views (full-text article views including HTML views, PDF and ePub downloads, according to the available data) and Abstracts Views on Vision4Press platform.
Data correspond to usage on the plateform after 2015. The current usage metrics is available 48-96 hours after online publication and is updated daily on week days.
Initial download of the metrics may take a while.