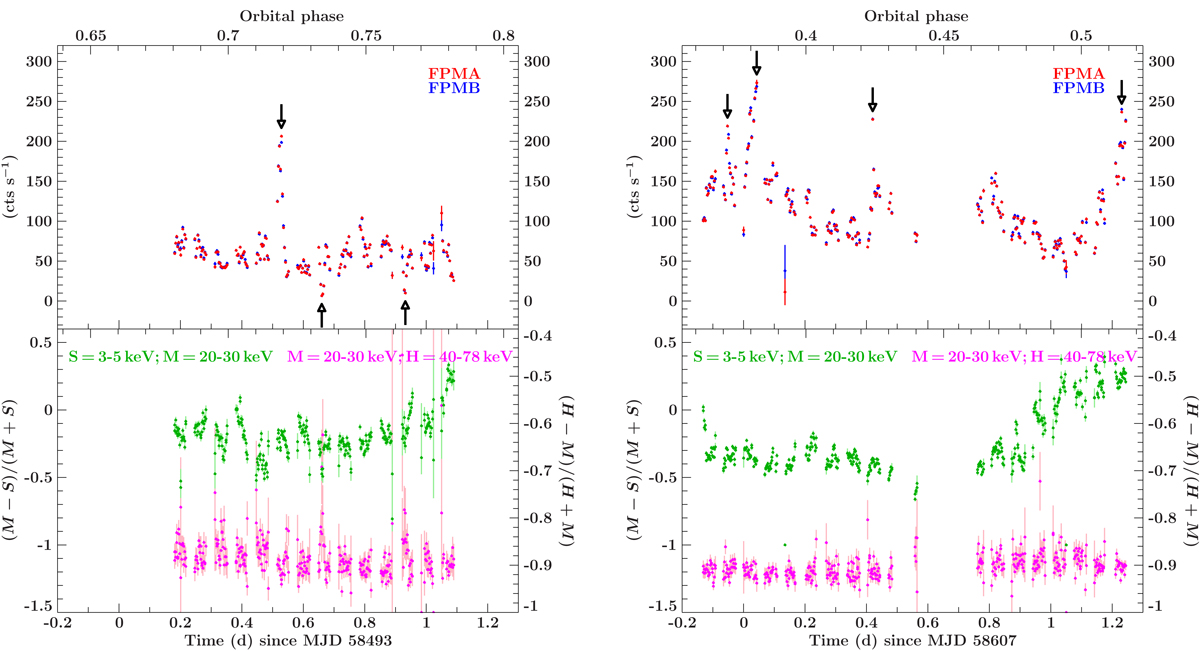
Fig. 2.
Download original image
Light curves and hardness ratios for observations I (left panel) and II (right panel) with a time resolution of PI = 283.4532 s and PII = 283.4447 s, respectively. Major off-states and major flares are indicated by arrows. Green points show the hardness ratio between the 3–5 keV and the 20–30 keV bands using the left-hand y axis. Magenta points show the hardness ratio between the 20–30 keV and the 40–78 keV bands using the right-hand y axis.
Current usage metrics show cumulative count of Article Views (full-text article views including HTML views, PDF and ePub downloads, according to the available data) and Abstracts Views on Vision4Press platform.
Data correspond to usage on the plateform after 2015. The current usage metrics is available 48-96 hours after online publication and is updated daily on week days.
Initial download of the metrics may take a while.