Fig. 3.
Download original image
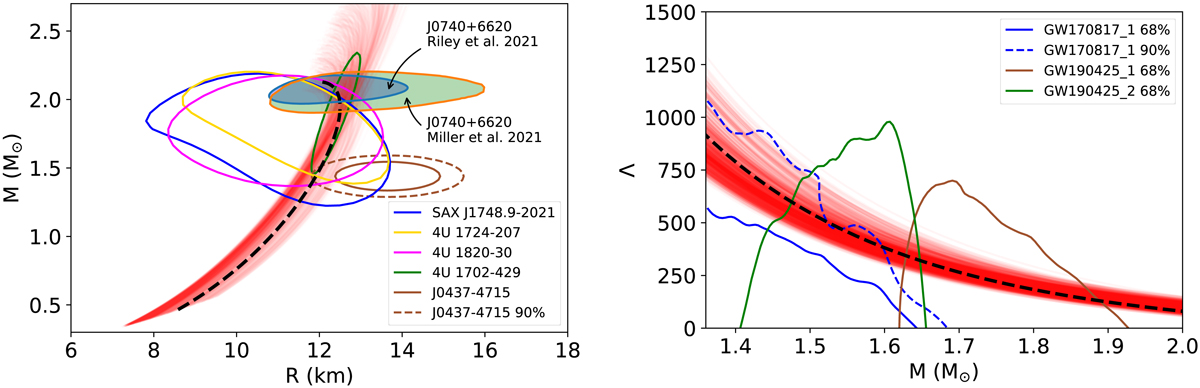
Inferred M − R (left) and M − Λ (right) curves for the 68% CI corresponding to the EOS posterior along with the sources also at 68% (solid lines). The light blue and green patches correspond to the latest mass and radius measurements of the pulsar J0740+6620 (Fonseca et al. 2021; Riley et al. 2021a; Miller et al. 2021a). The black dashed lines represent the most probable EOS. The brown dashed curve on the left panel denotes the 90% of J0437–4715. Additionally, the blue dashed curve on the right panel denotes the 90% of the heavier component of GW170817.
Current usage metrics show cumulative count of Article Views (full-text article views including HTML views, PDF and ePub downloads, according to the available data) and Abstracts Views on Vision4Press platform.
Data correspond to usage on the plateform after 2015. The current usage metrics is available 48-96 hours after online publication and is updated daily on week days.
Initial download of the metrics may take a while.