Fig. 2.
Download original image
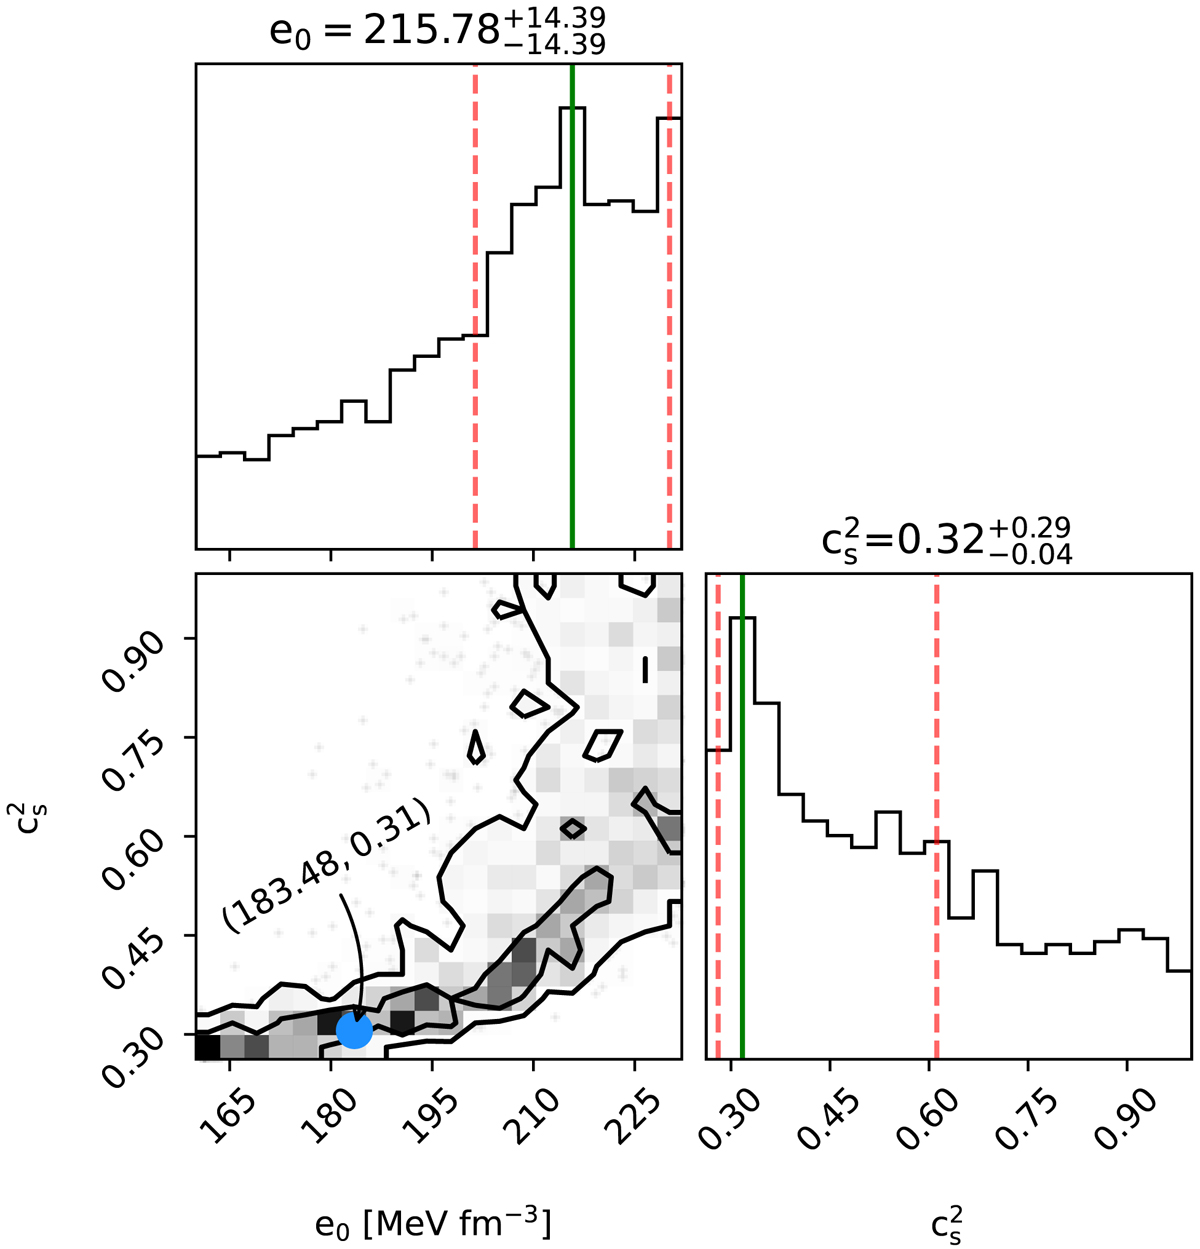
Posterior for e0 and ![]() resulting from the Bayesian analysis. The blue circle shows the most probable point of the joint distribution. In the correlation plot, the inner and the outer curves correspond to the 1σ and 90% CI, respectively. The green solid lines correspond to the modes of the marginalized PDFs, while the red dashed lines show the corresponding 1σ errors.
resulting from the Bayesian analysis. The blue circle shows the most probable point of the joint distribution. In the correlation plot, the inner and the outer curves correspond to the 1σ and 90% CI, respectively. The green solid lines correspond to the modes of the marginalized PDFs, while the red dashed lines show the corresponding 1σ errors.
Current usage metrics show cumulative count of Article Views (full-text article views including HTML views, PDF and ePub downloads, according to the available data) and Abstracts Views on Vision4Press platform.
Data correspond to usage on the plateform after 2015. The current usage metrics is available 48-96 hours after online publication and is updated daily on week days.
Initial download of the metrics may take a while.