Fig. 1.
Download original image
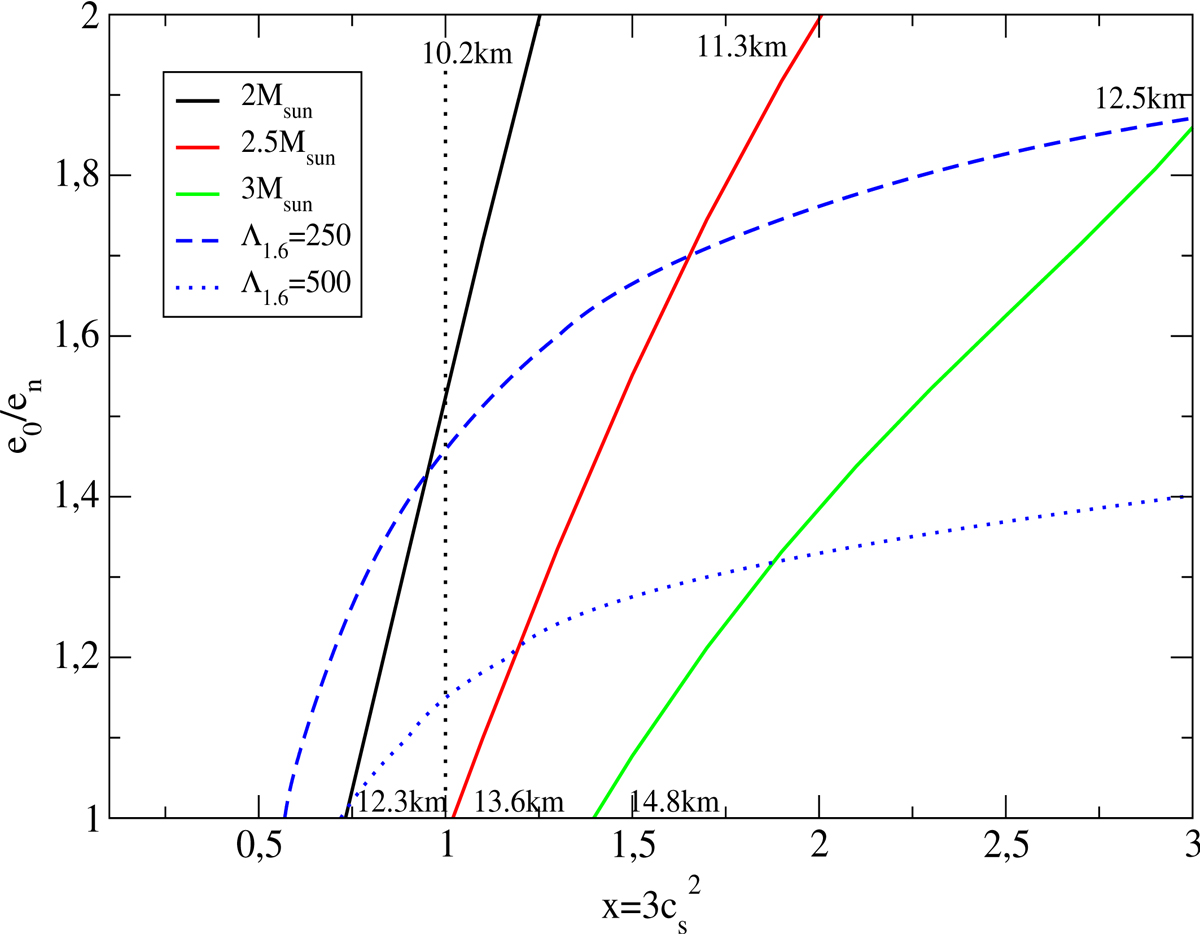
Contour plot for mmax. Solid lines show the curves of constant maximum mass in the parameter space of the CSS model. At the beginning and at the end of those lines, the radii corresponding to the maximum mass configurations are also indicated. The vertical dotted line indicates the conformal limit. The blue dashed and dotted lines are curves of constant Λ1.6, for the two values Λ1.6 = 250 and 500, which are close to the 68% and 90% confidence interval obtained from the analysis of GW170817 (see Fig. 3).
Current usage metrics show cumulative count of Article Views (full-text article views including HTML views, PDF and ePub downloads, according to the available data) and Abstracts Views on Vision4Press platform.
Data correspond to usage on the plateform after 2015. The current usage metrics is available 48-96 hours after online publication and is updated daily on week days.
Initial download of the metrics may take a while.