Fig. 9.
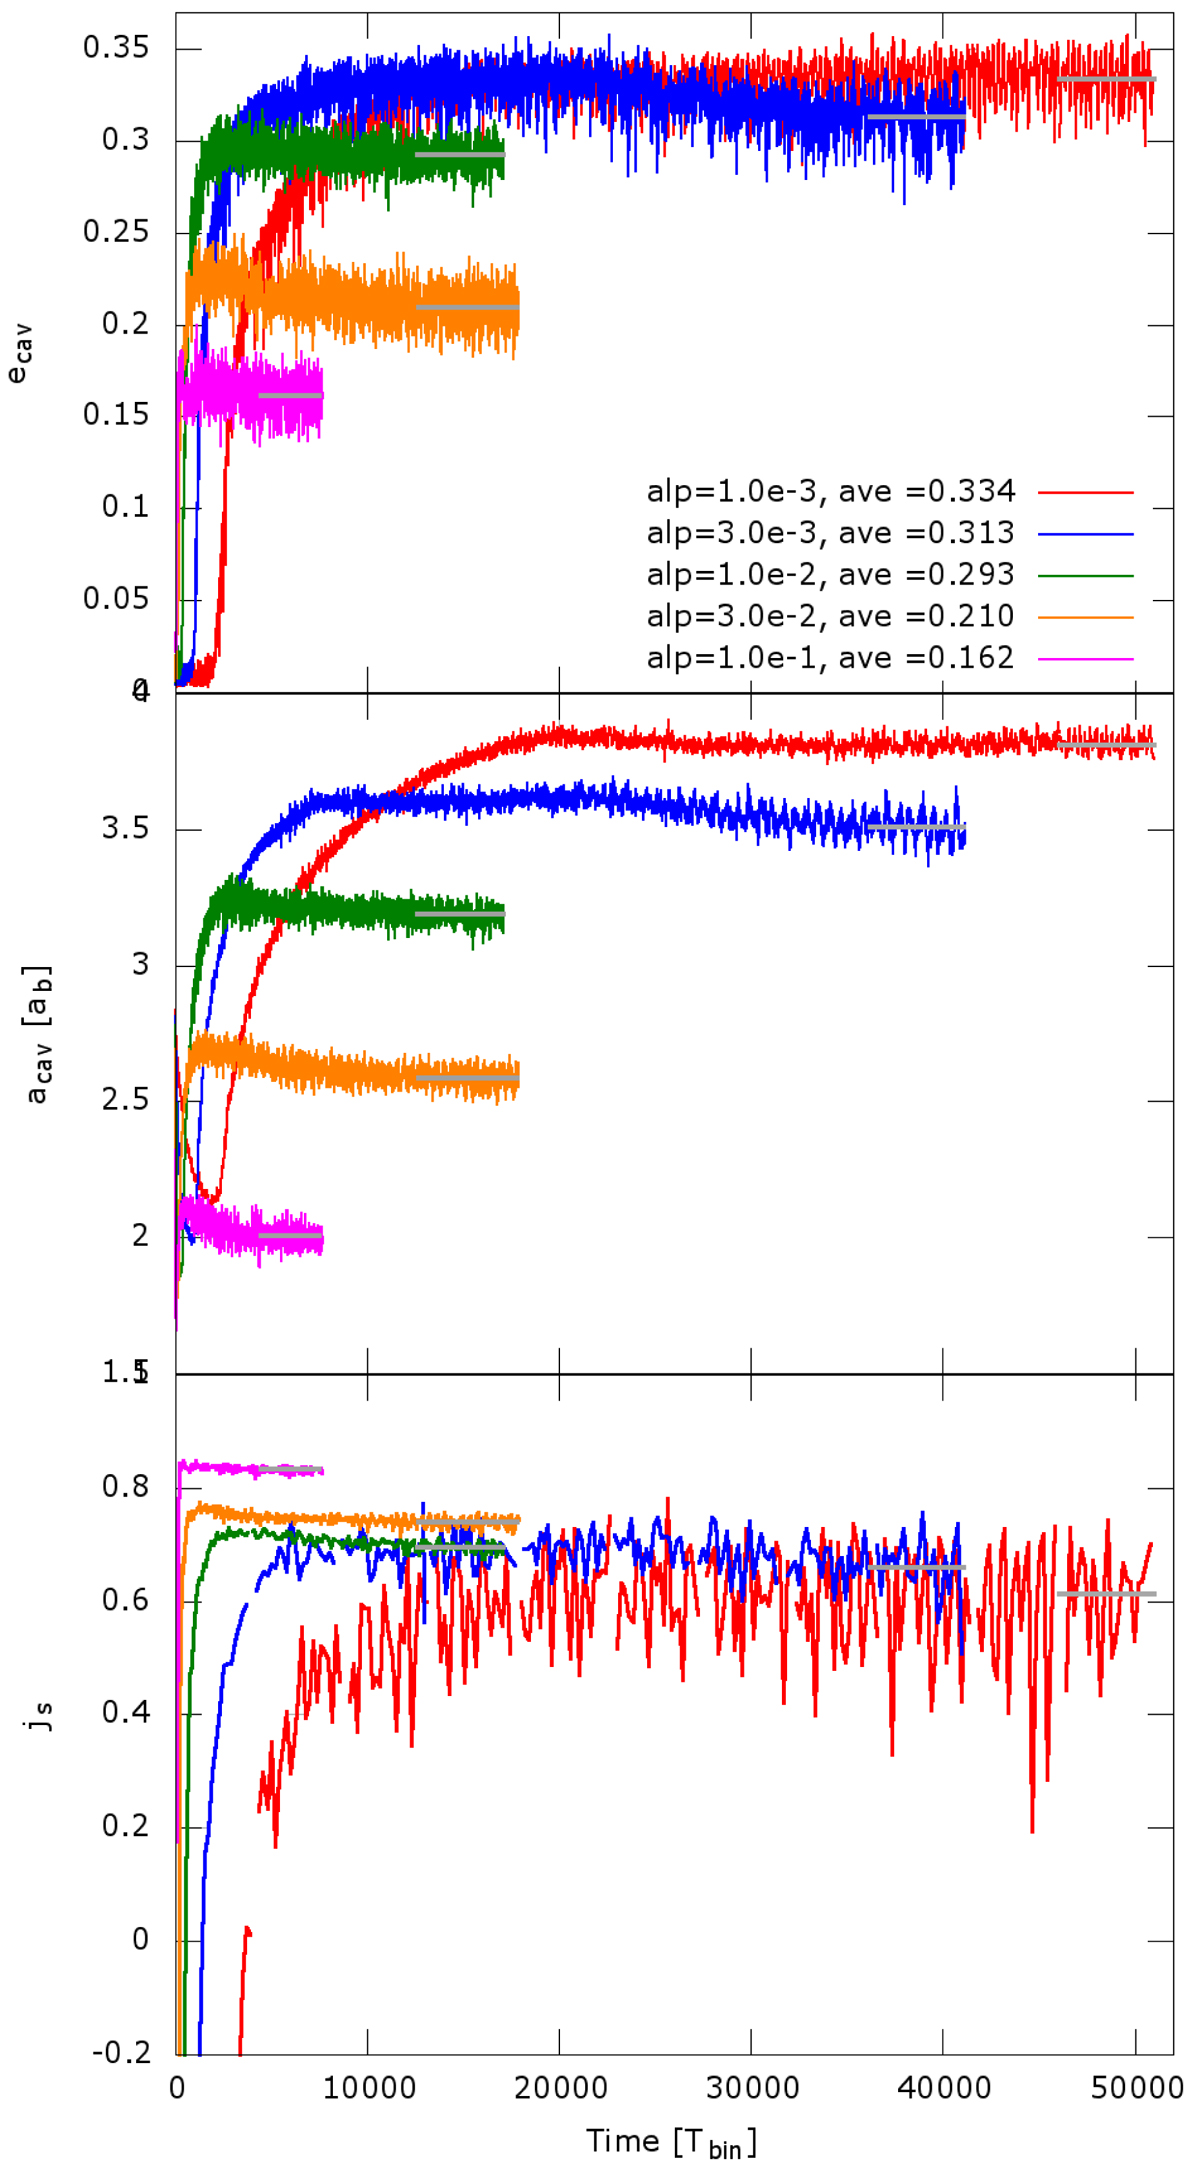
Download original image
Shape and size of the cavity around the binary (with q = 0.5) and the tranferred specific angular momentum js as a function of time for models with different viscosity and an aspect ratio h = 0.1. Top two panels show sliding time averages over 10 Tbin, the bottom panel shows 200 Tbin for the two lowest α models, over 100 Tbin for α = 0.01, and over 50 Tbin for α = 0.03 and 0.1. The grey lines indicate the averaging interval for the final quoted equilibrium values. Simulations were performed with the RH2D code.
Current usage metrics show cumulative count of Article Views (full-text article views including HTML views, PDF and ePub downloads, according to the available data) and Abstracts Views on Vision4Press platform.
Data correspond to usage on the plateform after 2015. The current usage metrics is available 48-96 hours after online publication and is updated daily on week days.
Initial download of the metrics may take a while.