Fig. 17.
Download original image
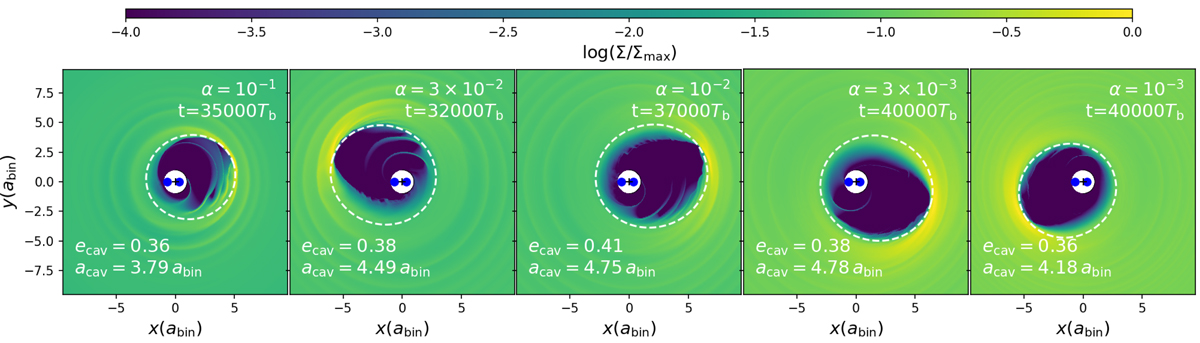
Snapshots of the surface density for infinite disc models with q = 0.5 and H/R = 0.05 for different viscosities, ranging from α = 0.1 (left) to α = 0.001 (right). We show the inner region of the disc for the higher-resolution models in their final state at the times indicated. The dashed white lines indicate the ellipses fitted to the cavity with the parameters quoted. The blue dots mark the position of the stars.
Current usage metrics show cumulative count of Article Views (full-text article views including HTML views, PDF and ePub downloads, according to the available data) and Abstracts Views on Vision4Press platform.
Data correspond to usage on the plateform after 2015. The current usage metrics is available 48-96 hours after online publication and is updated daily on week days.
Initial download of the metrics may take a while.