Free Access
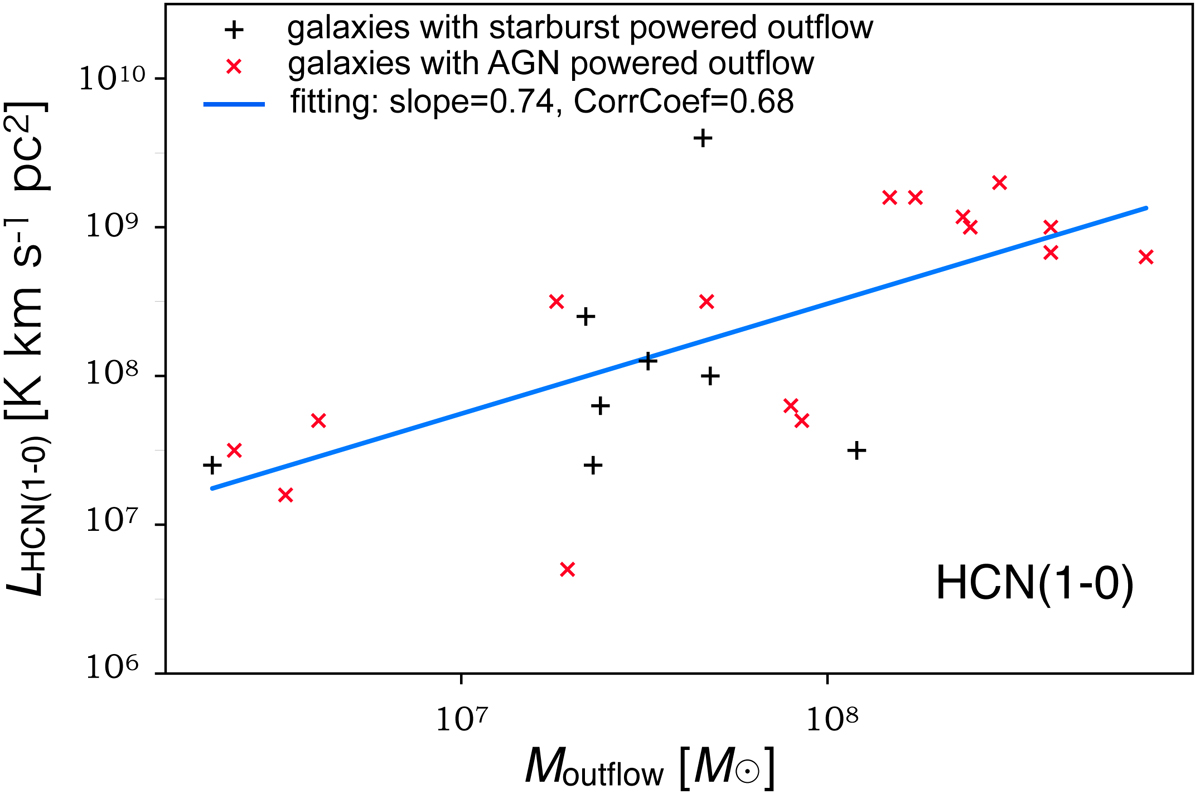
Fig. 5.
Download original image
Same plot as Fig. 4 but for the luminosities of HCN 1–0. The values for the molecular mass of the outflow, Moutflow, are from Fluetsch et al. (2019). The LHCN1−0 values are from the references in Table 6. AGN-powered outflows are indicated with the red ‘x’ symbol.
Current usage metrics show cumulative count of Article Views (full-text article views including HTML views, PDF and ePub downloads, according to the available data) and Abstracts Views on Vision4Press platform.
Data correspond to usage on the plateform after 2015. The current usage metrics is available 48-96 hours after online publication and is updated daily on week days.
Initial download of the metrics may take a while.