Fig. 6.
Download original image
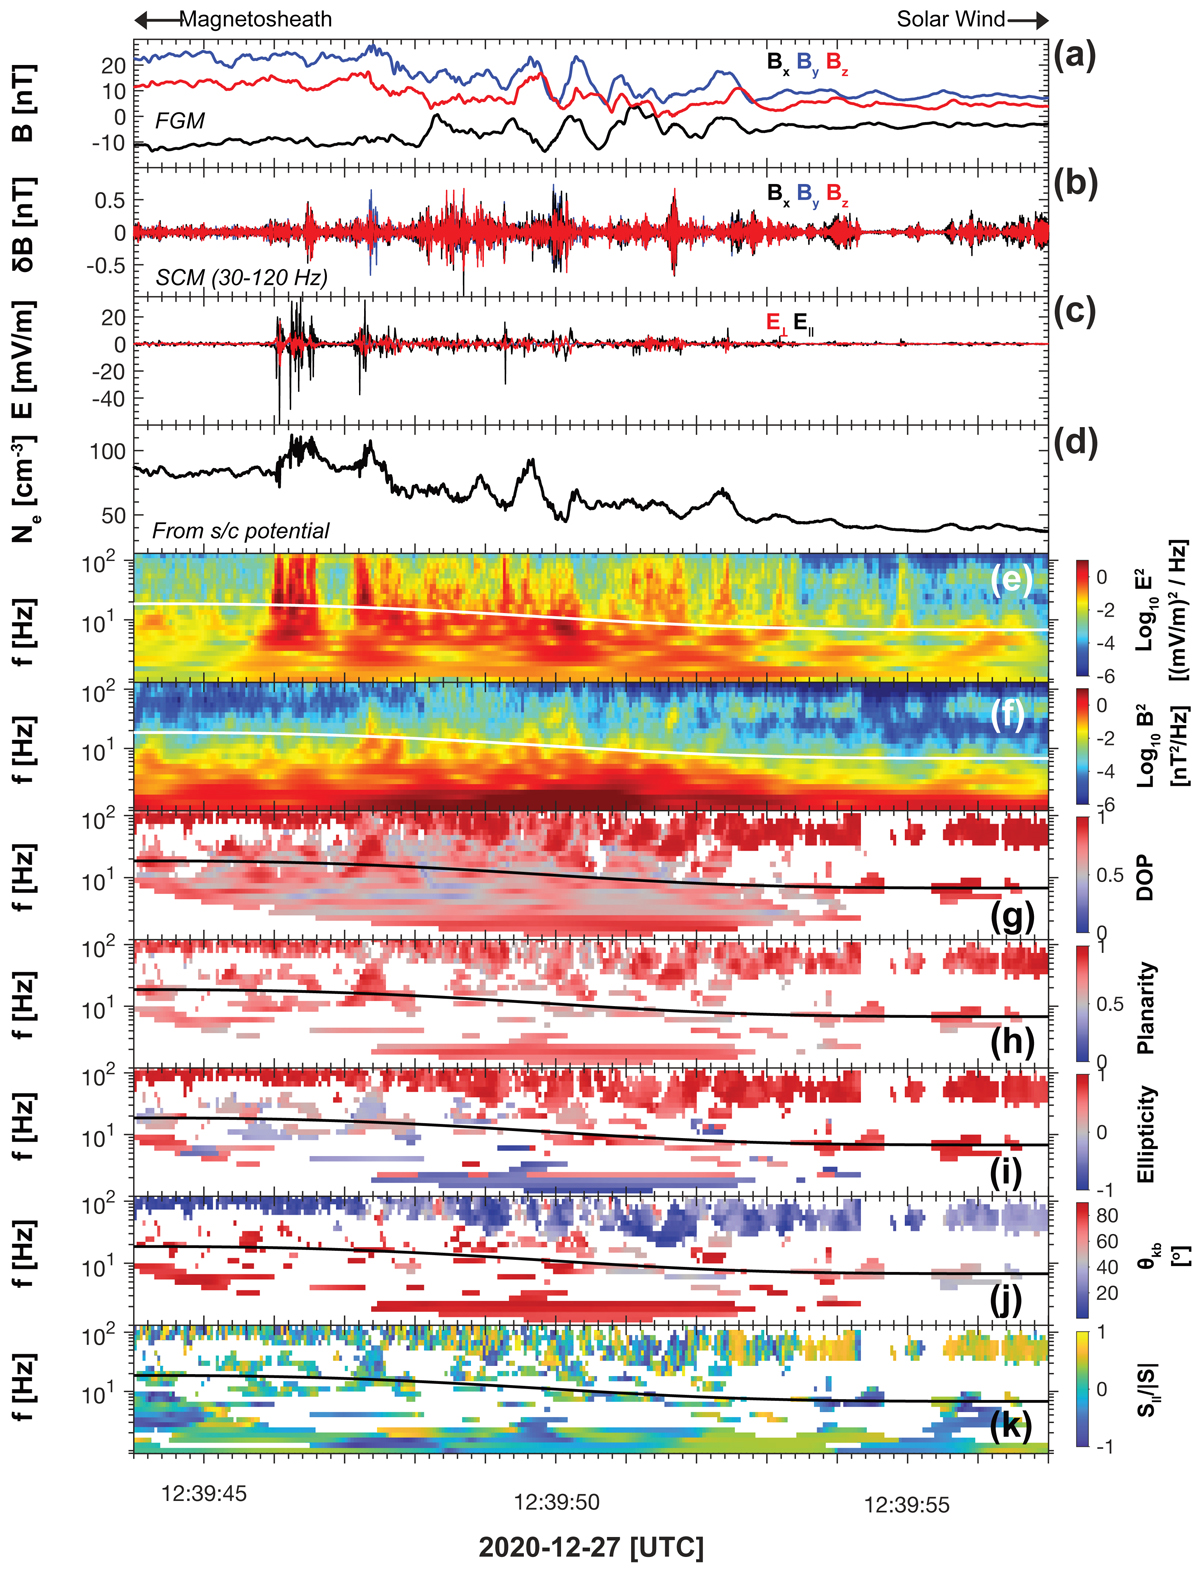
Polarization analysis of the magnetic and electric field across the shock front. Displayed in panels a–d are FGM magnetic field, SCM magnetic field (30–12 Hz), electric field, and electron density, respectively. Panels e and f are spectrograms of the electric field and SCM data. The remaining panels g and h correspond to the degree of polarization, planarity, ellipticity, θkb, and Poynting flux.
Current usage metrics show cumulative count of Article Views (full-text article views including HTML views, PDF and ePub downloads, according to the available data) and Abstracts Views on Vision4Press platform.
Data correspond to usage on the plateform after 2015. The current usage metrics is available 48-96 hours after online publication and is updated daily on week days.
Initial download of the metrics may take a while.