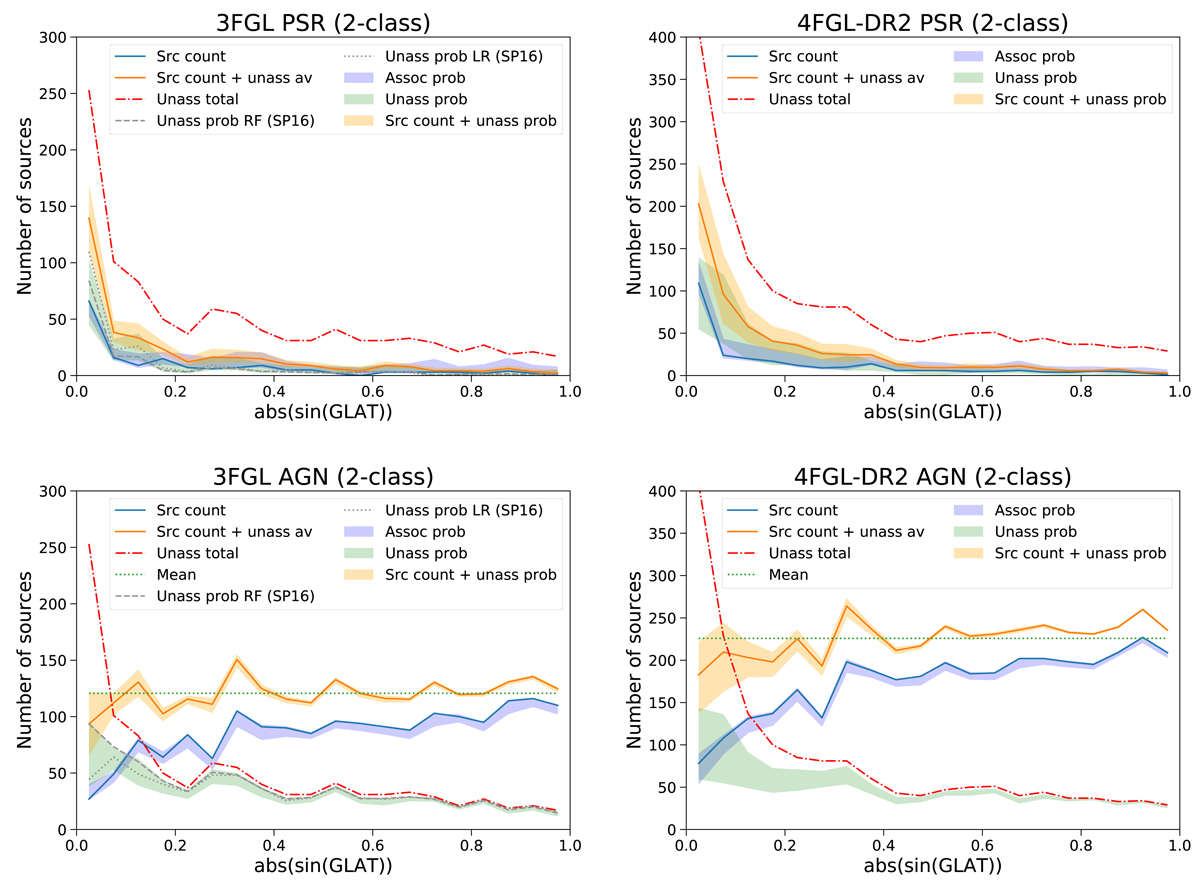
Fig. 21.
Download original image
Latitude profiles of source counts in the case of two-class classification. Solid blue lines represent associated 3FGL and 4FGL-DR2 sources; red dash-dotted lines show counts of all unassociated sources; blue bands show the envelope of sums of class probabilities for associated sources for the eight ML methods with and without oversampling corrected for the presence of OTHER sources; green bands show the envelope of sums of class probabilities for unassociated sources for the eight ML methods corrected for the presence of OTHER sources; solid orange lines (bands) show the average (envelope) of sums of class probabilities for the eight ML methods added to the source count of associated sources; green dotted lines on the AGN plots show the mean of the orange solid lines; and gray dashed (dotted) lines show the RF (LR) sums of class probabilities from Saz Parkinson et al. (2016) (for details, see Sect. 6.2).
Current usage metrics show cumulative count of Article Views (full-text article views including HTML views, PDF and ePub downloads, according to the available data) and Abstracts Views on Vision4Press platform.
Data correspond to usage on the plateform after 2015. The current usage metrics is available 48-96 hours after online publication and is updated daily on week days.
Initial download of the metrics may take a while.