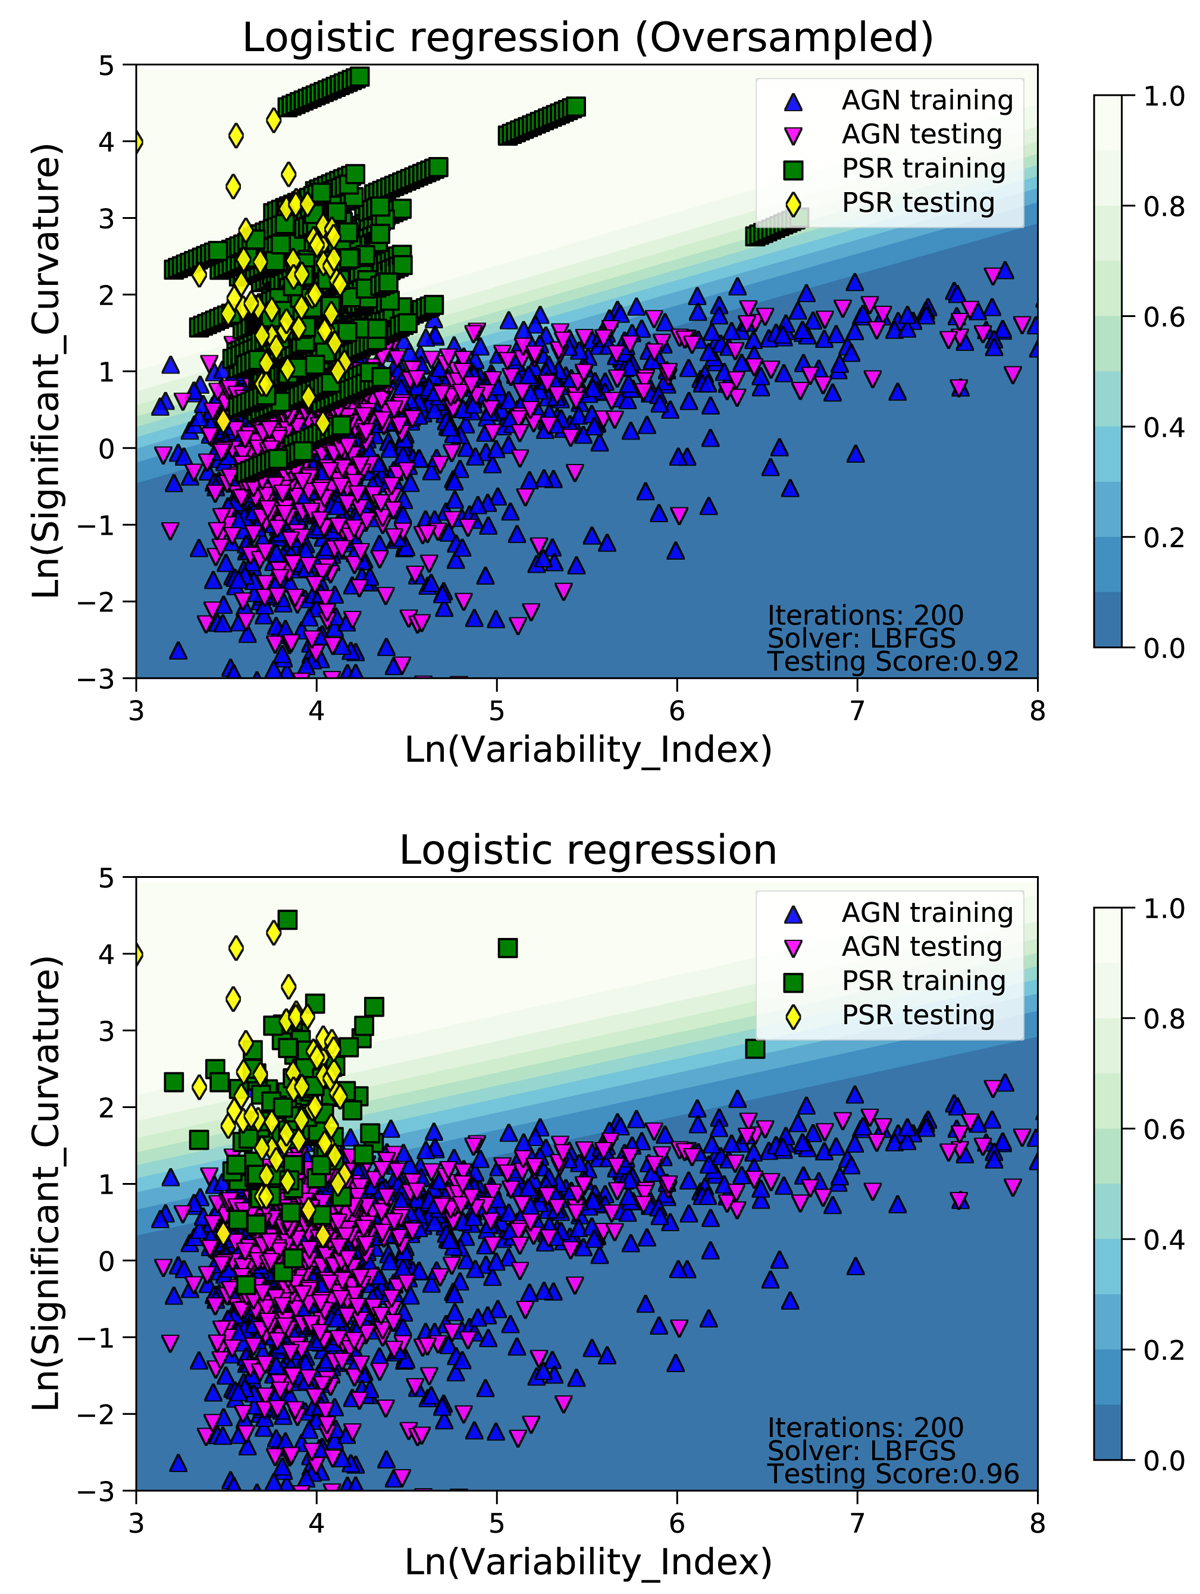
Fig. 13.
Download original image
Comparison of classification domains for the LR method with and without oversampling. Top panel: LR classification domains showing class probabilities for training with oversampling. The oversampling is illustrated by repeating the pulsar markers with a shift: the number of markers is equal to the number of times the pulsar appears in training. Bottom panel: repeat of Fig. 11 for the convenience of comparison with the oversampled training in the top panel. In both panels the domains are obtained by averaging over 100 random splits into training and testing samples.
Current usage metrics show cumulative count of Article Views (full-text article views including HTML views, PDF and ePub downloads, according to the available data) and Abstracts Views on Vision4Press platform.
Data correspond to usage on the plateform after 2015. The current usage metrics is available 48-96 hours after online publication and is updated daily on week days.
Initial download of the metrics may take a while.