Free Access
Fig. 7
Download original image
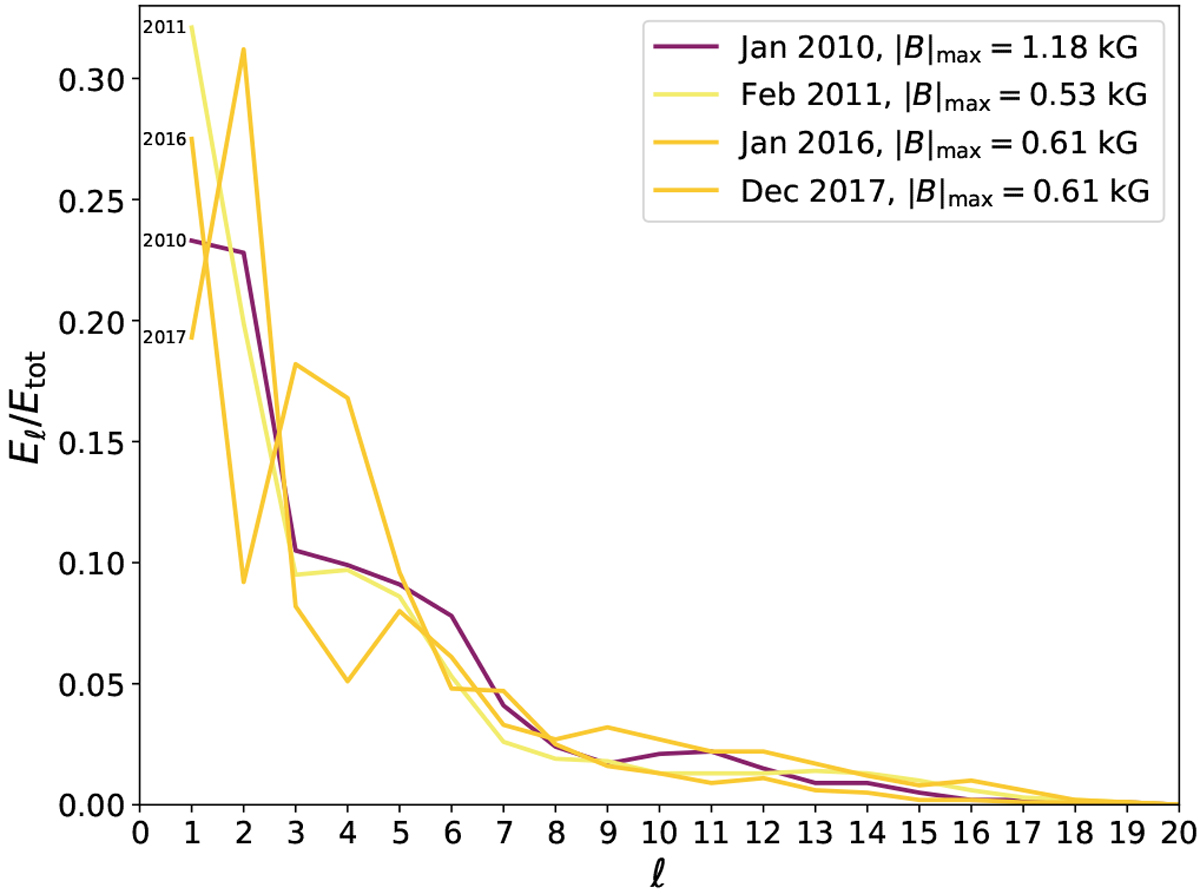
Magnetic energy spectra of the ZDI maps as a function of the angular order ℓ, normalised by the total magnetic energy Etot. The line colours indicate the maximum field strength |B|max in each map, as given in the legend, darker colours denoting stronger fields.
Current usage metrics show cumulative count of Article Views (full-text article views including HTML views, PDF and ePub downloads, according to the available data) and Abstracts Views on Vision4Press platform.
Data correspond to usage on the plateform after 2015. The current usage metrics is available 48-96 hours after online publication and is updated daily on week days.
Initial download of the metrics may take a while.