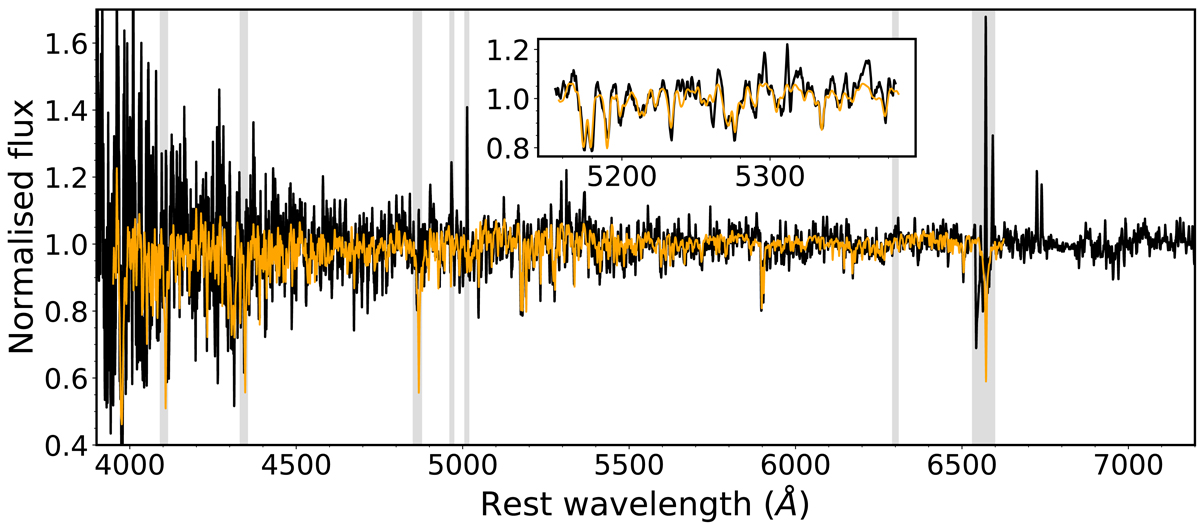
Fig. A.1.
Download original image
Magellan/MagE spectrum (black) of the host galaxy of eRO-QPE1. Overlaid in orange is the best-fit template that was used to measure the host velocity dispersion. The inset shows the region around the Mg I b triplet to illustrate the quality of the fit. Grey bands indicate host galaxy emission lines, which were excluded from the fit. The spectrum was convolved with a Gaussian kernel with a width of 5 pixels for clarity.
Current usage metrics show cumulative count of Article Views (full-text article views including HTML views, PDF and ePub downloads, according to the available data) and Abstracts Views on Vision4Press platform.
Data correspond to usage on the plateform after 2015. The current usage metrics is available 48-96 hours after online publication and is updated daily on week days.
Initial download of the metrics may take a while.