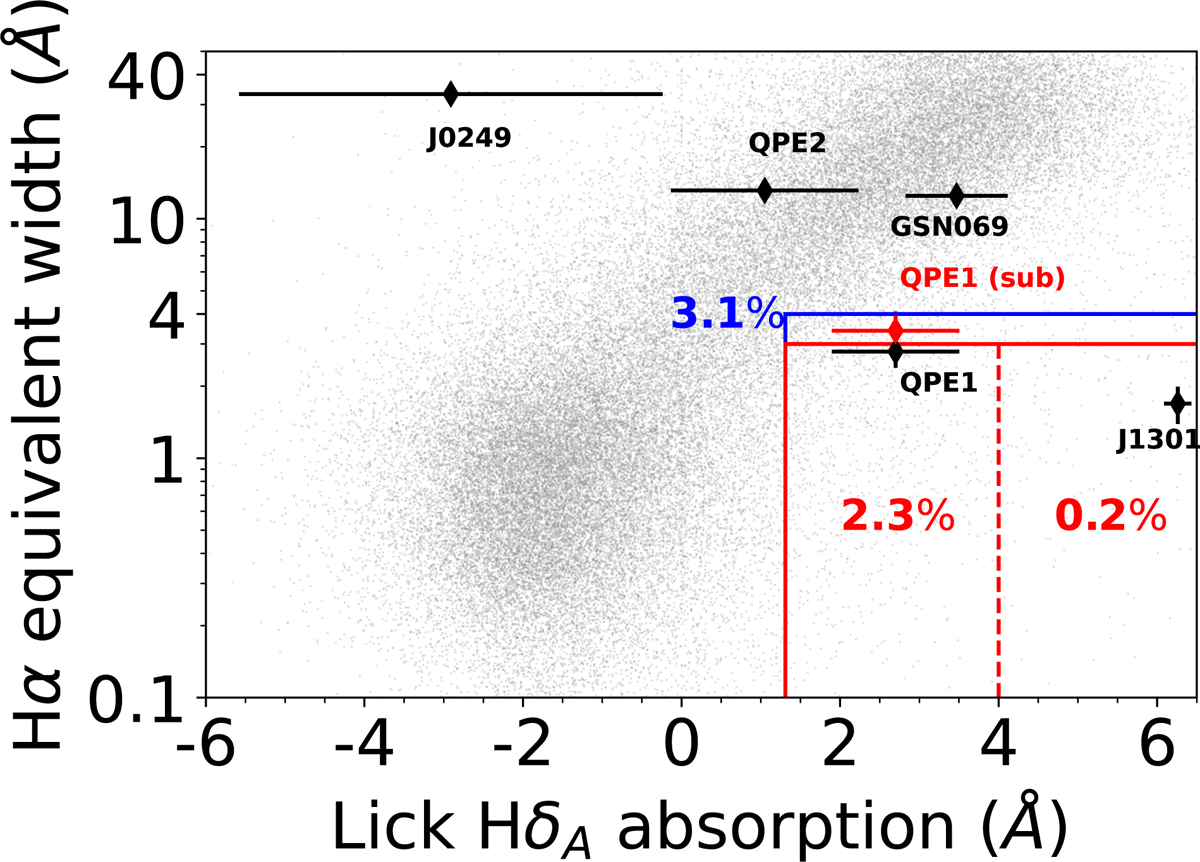
Fig. 4.
Download original image
Spectral properties of SDSS galaxies (grey dots) and QPE hosts (diamonds). Two out of the five QPE hosts lie in a sparsely populated region of this diagram of Hα EW vs. the Lick HδA absorption index. The relative fraction of sources within the coloured boxes is shown: E+A galaxies represent only 0.2% of SDSS galaxies (red dashed box), while quiescent Balmer strong galaxies represent 2.3% (red solid box). The slightly widened (blue) box that encompasses eRO-QPE1 (Hα EW < 4 Å) contains 3.1% of SDSS galaxies.
Current usage metrics show cumulative count of Article Views (full-text article views including HTML views, PDF and ePub downloads, according to the available data) and Abstracts Views on Vision4Press platform.
Data correspond to usage on the plateform after 2015. The current usage metrics is available 48-96 hours after online publication and is updated daily on week days.
Initial download of the metrics may take a while.