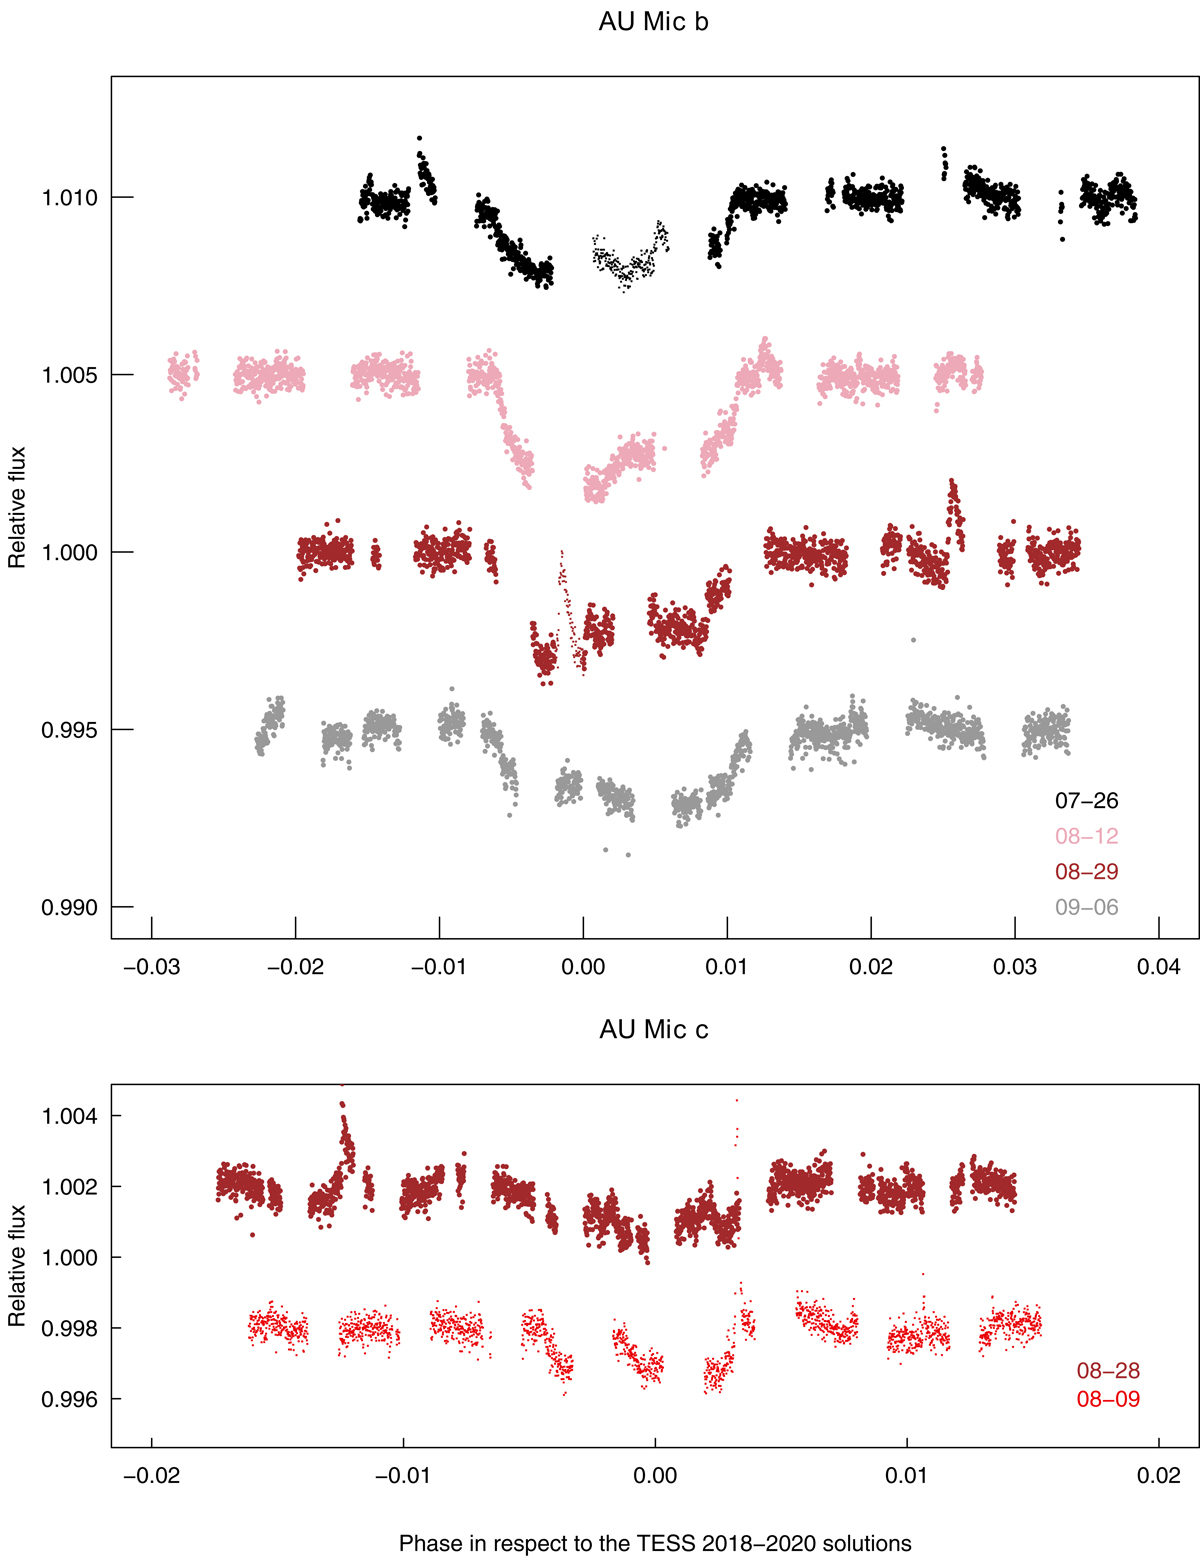
Fig. A.1.
Download original image
CHEOPS observations of AU Mic b (upper panel) and AU Mic c (lower panel) transits analyzed in this Letter. The 21-07-26 and 21-08-29 transits of AU Mic b were contaminated by flares. These points have been omitted from light curve fitting (plotted here with smaller dots). The labels show the date of the start of the visits in MM-DD format. The pixel/flux scale of the two panels is equal in order to show the relative amplitudes of the two planets.
Current usage metrics show cumulative count of Article Views (full-text article views including HTML views, PDF and ePub downloads, according to the available data) and Abstracts Views on Vision4Press platform.
Data correspond to usage on the plateform after 2015. The current usage metrics is available 48-96 hours after online publication and is updated daily on week days.
Initial download of the metrics may take a while.