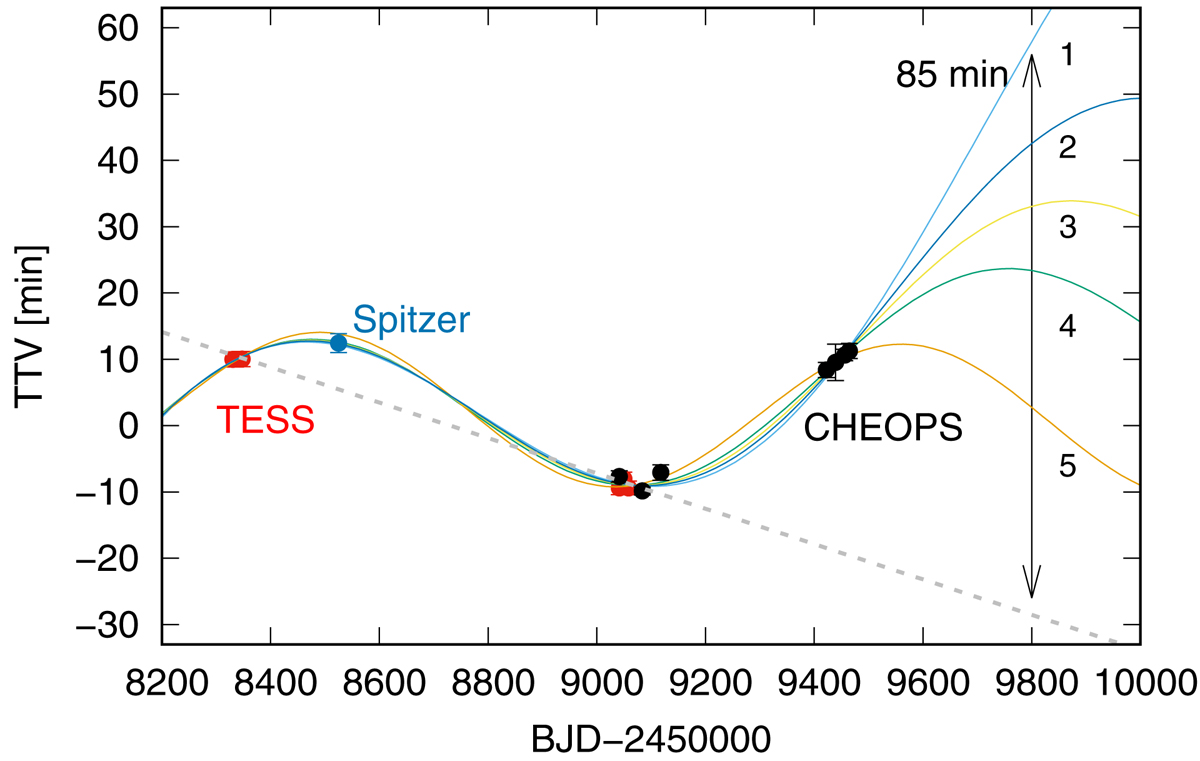
Fig. 4.
Download original image
Different predictions from the simplest harmonic TTV models to the 2022 opposition (colored curves) and the previously published linear ephemeris (gray dotted line). The colored curves fit equally well to all data points (see Table A.4 for their coefficients). Transits in 2022 August are expected to occur 40−85 min later than predictions prior to the CHEOPS 2021 observations.
Current usage metrics show cumulative count of Article Views (full-text article views including HTML views, PDF and ePub downloads, according to the available data) and Abstracts Views on Vision4Press platform.
Data correspond to usage on the plateform after 2015. The current usage metrics is available 48-96 hours after online publication and is updated daily on week days.
Initial download of the metrics may take a while.