Fig. 3.
Download original image
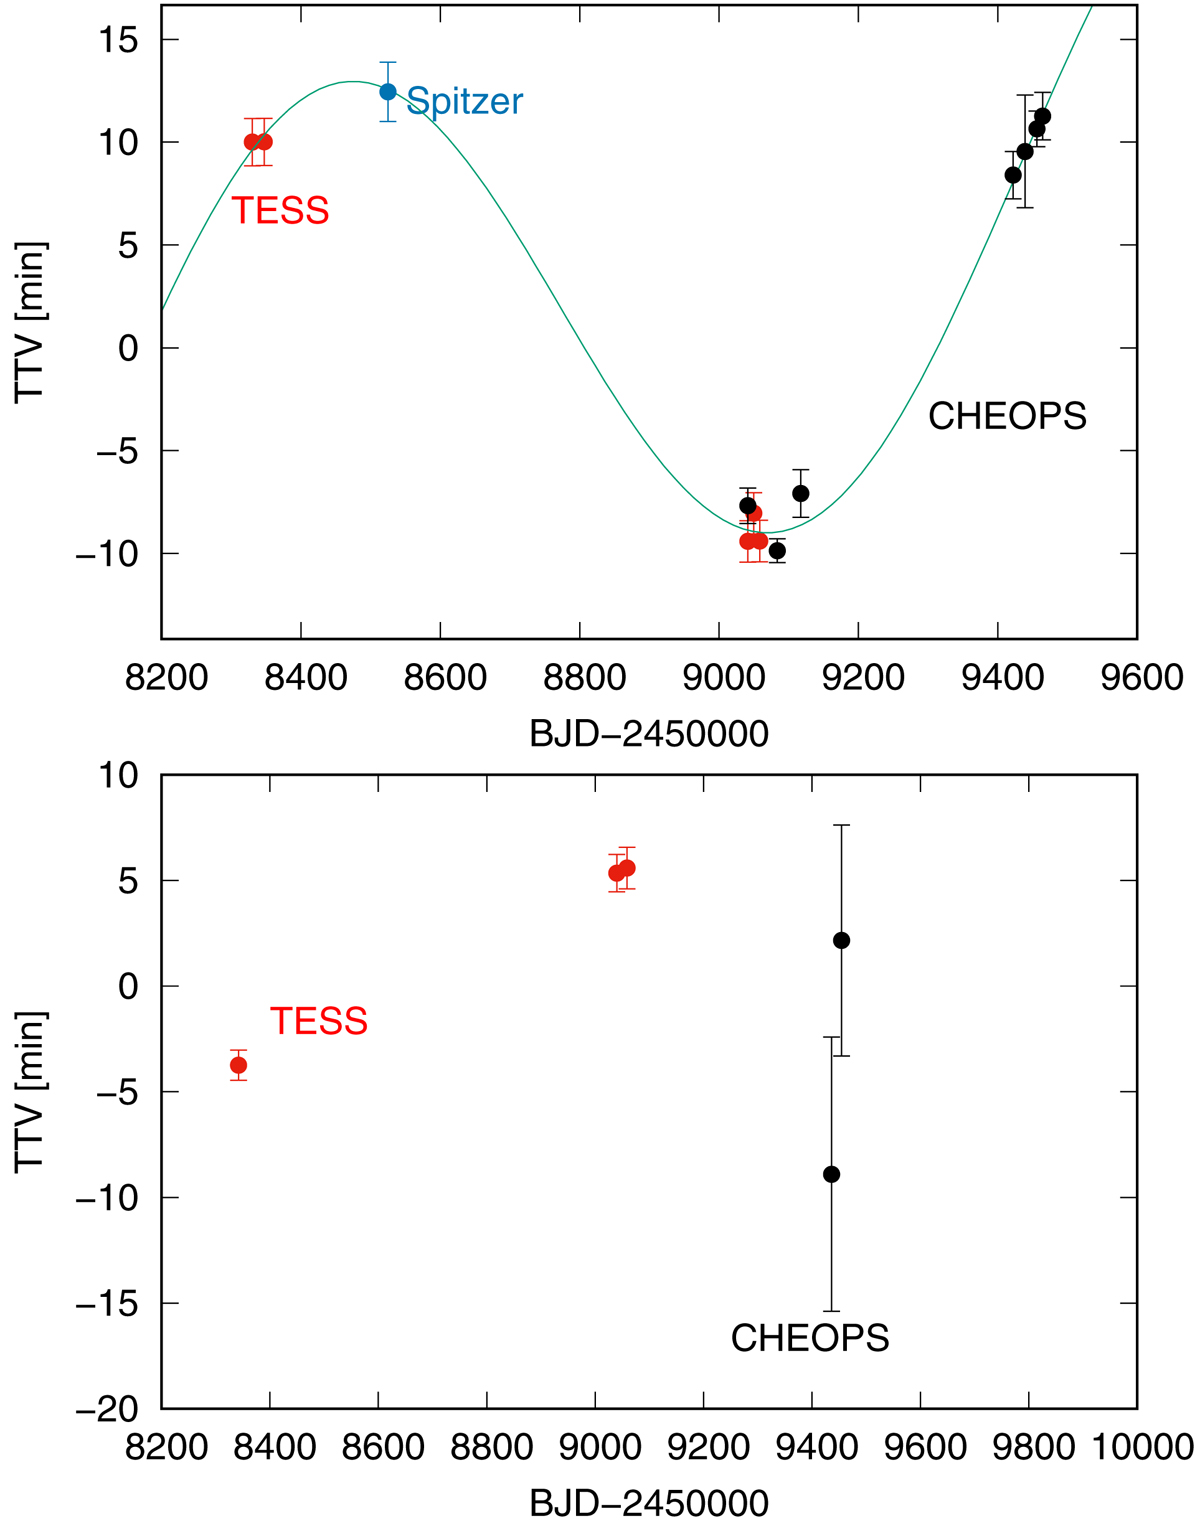
TTV diagrams of AU Mic b (upper panel) calculated with Tc = 2 458 330.38416 and Pmean = 8.4631427 d, and AU Mic c (lower panel) calculated with Tc = 9454.8973 and Pmean = 18.85882 d. We included TESS (red symbols), Spitzer (blue symbols), and CHEOPS (black symbols) measurements. The harmonic fit to AU Mic b data illustrates the most probable shape of a periodic TTV fitted to the data. This is shown to illustrate the trend of the distribution without any dynamical interpretation.
Current usage metrics show cumulative count of Article Views (full-text article views including HTML views, PDF and ePub downloads, according to the available data) and Abstracts Views on Vision4Press platform.
Data correspond to usage on the plateform after 2015. The current usage metrics is available 48-96 hours after online publication and is updated daily on week days.
Initial download of the metrics may take a while.