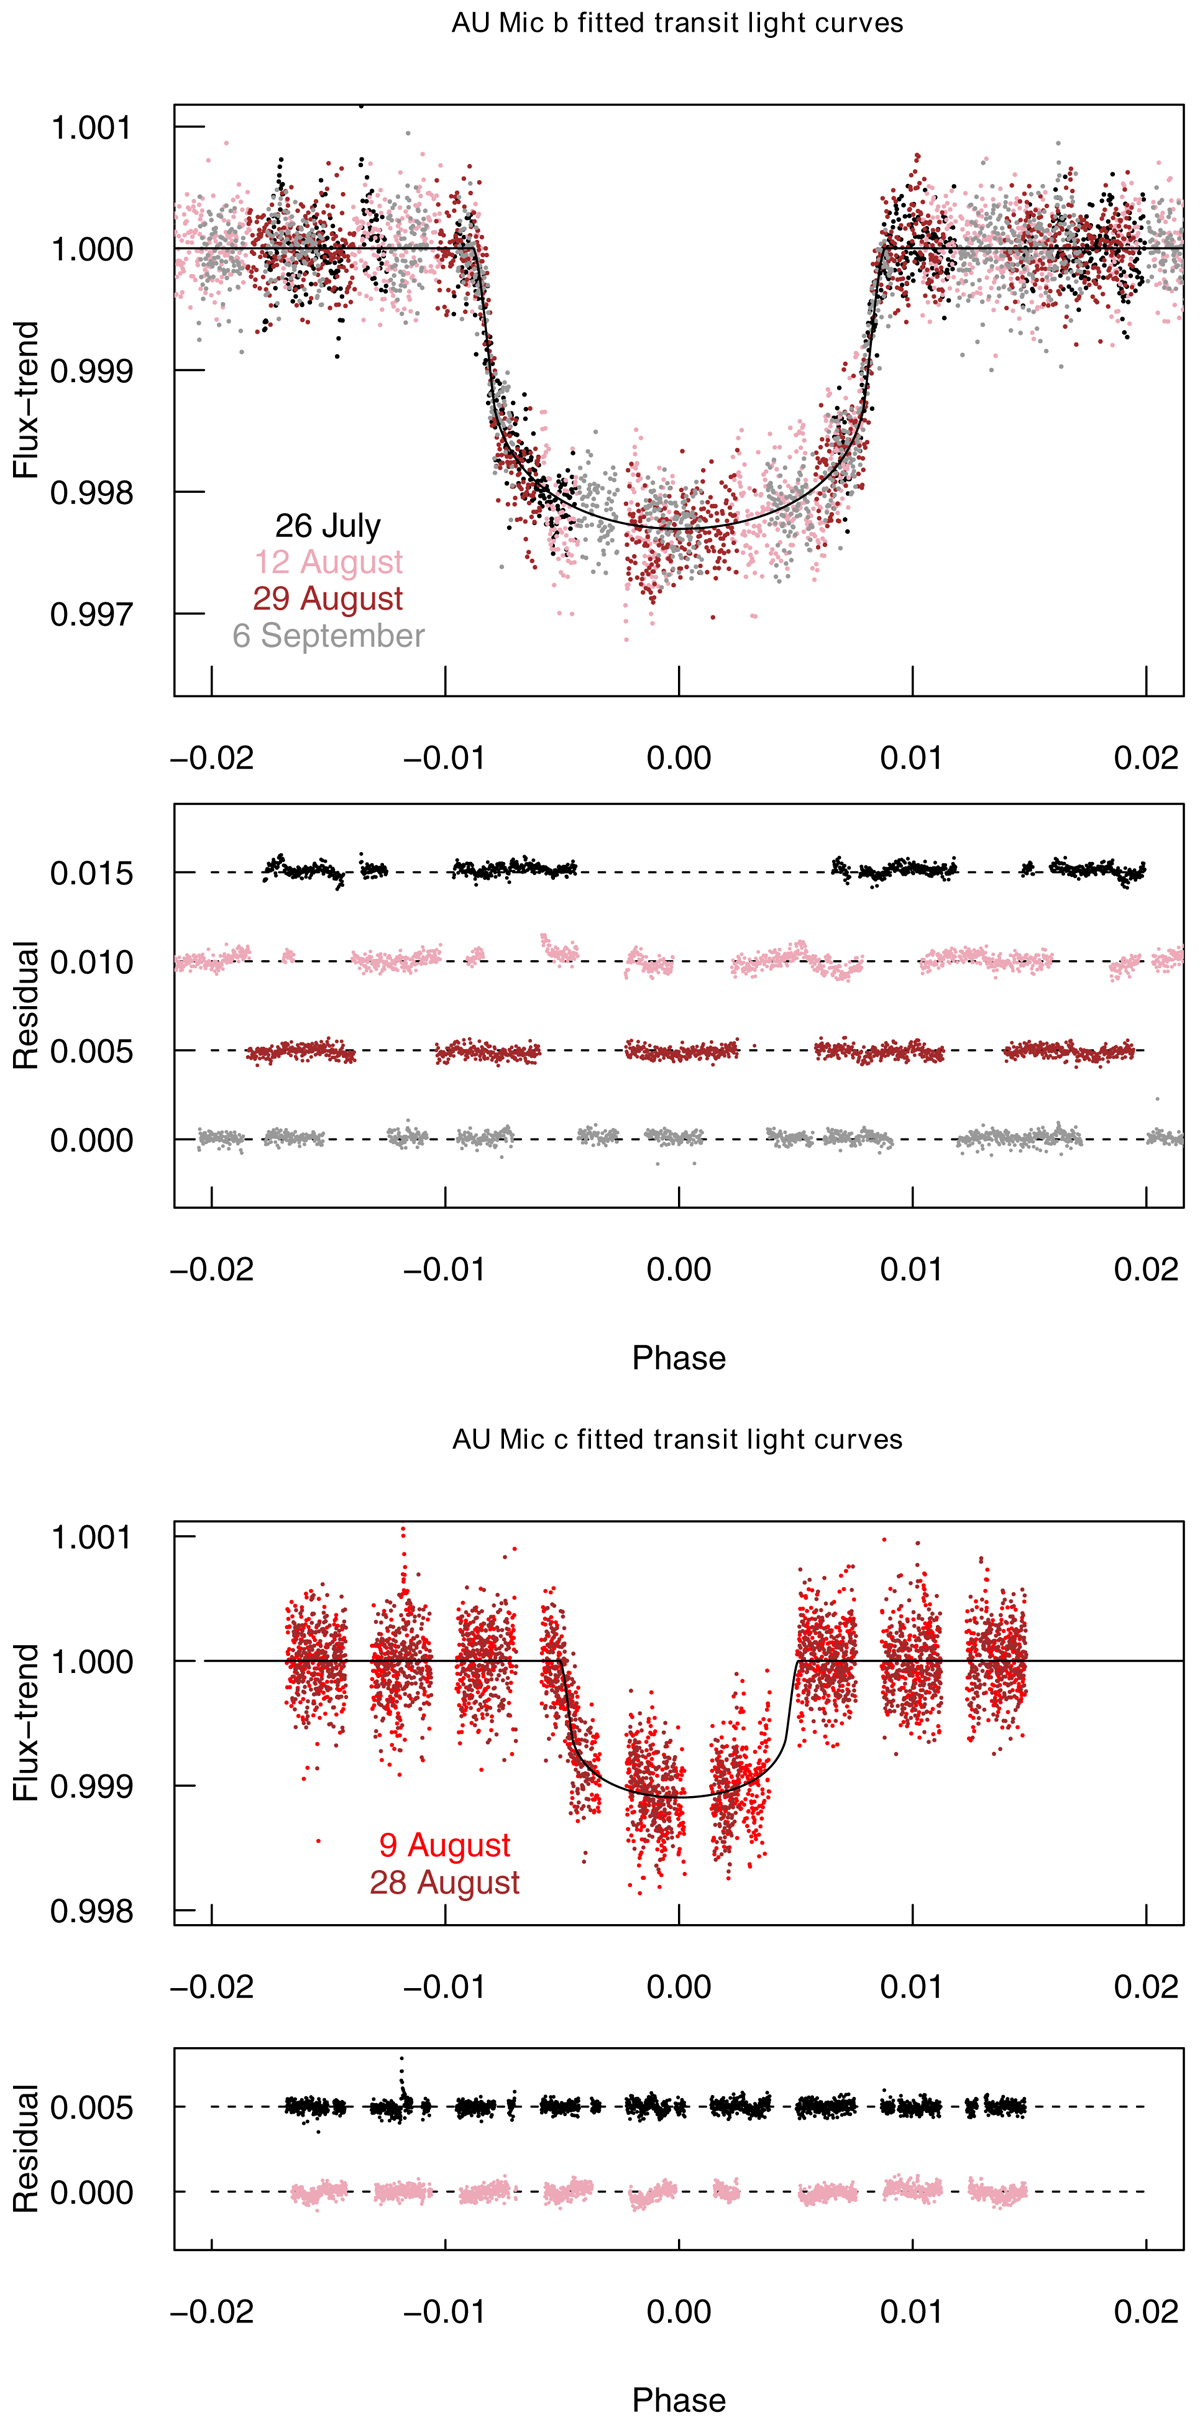
Fig. 2.
Download original image
Best-fit transit solutions of the four CHEOPS visits of AU Mic b (upper panels) and AU Mic c (lower panels) analyzed in this Letter, after omitting the flares during the transits. The phased points of the individual light curves are shown in light blue, and the binned light curve points of the individual transits are shown in dark blue. Lower panel: residuals observed at each individual visit. We highlight the increased variability of the light curve shape before the mid-transit of AU Mic b.
Current usage metrics show cumulative count of Article Views (full-text article views including HTML views, PDF and ePub downloads, according to the available data) and Abstracts Views on Vision4Press platform.
Data correspond to usage on the plateform after 2015. The current usage metrics is available 48-96 hours after online publication and is updated daily on week days.
Initial download of the metrics may take a while.