Fig. 9
Download original image
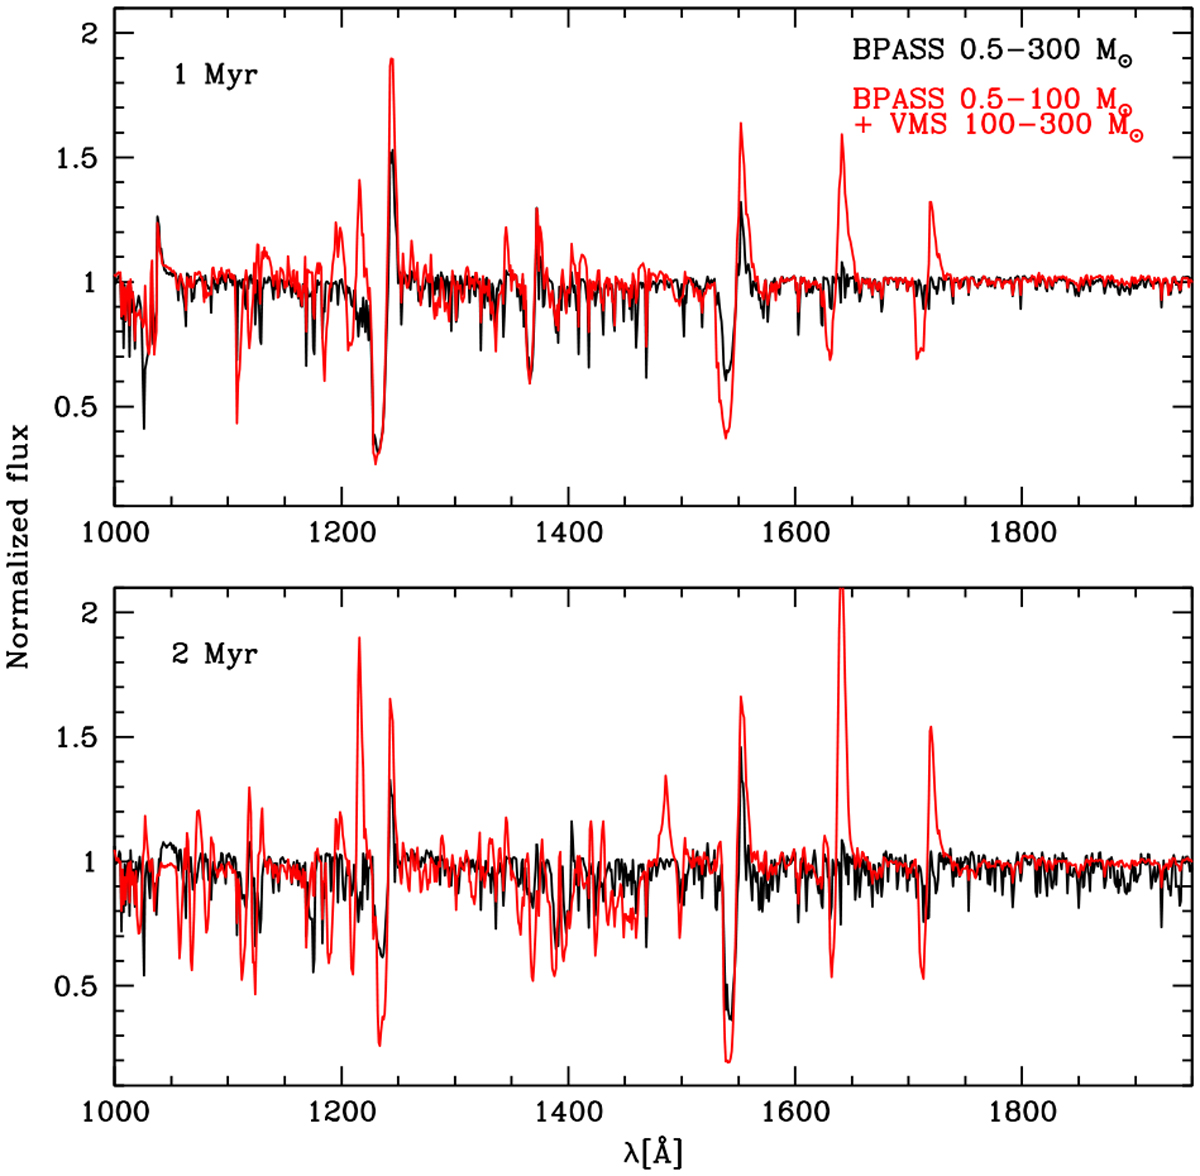
Normalized UV spectrum of population synthesis models. Black lines are the BPASS model extending to 300 M⊙. The red line is the combination of the BPASS model up to 100 M⊙ and the additional contribution of VMSs from our models and a Salpeter IMF slope for 100-300 M⊙. The top (bottom) panel is for a burst of star formation after 1 (2) Myr..
Current usage metrics show cumulative count of Article Views (full-text article views including HTML views, PDF and ePub downloads, according to the available data) and Abstracts Views on Vision4Press platform.
Data correspond to usage on the plateform after 2015. The current usage metrics is available 48-96 hours after online publication and is updated daily on week days.
Initial download of the metrics may take a while.