Fig. 8
Download original image
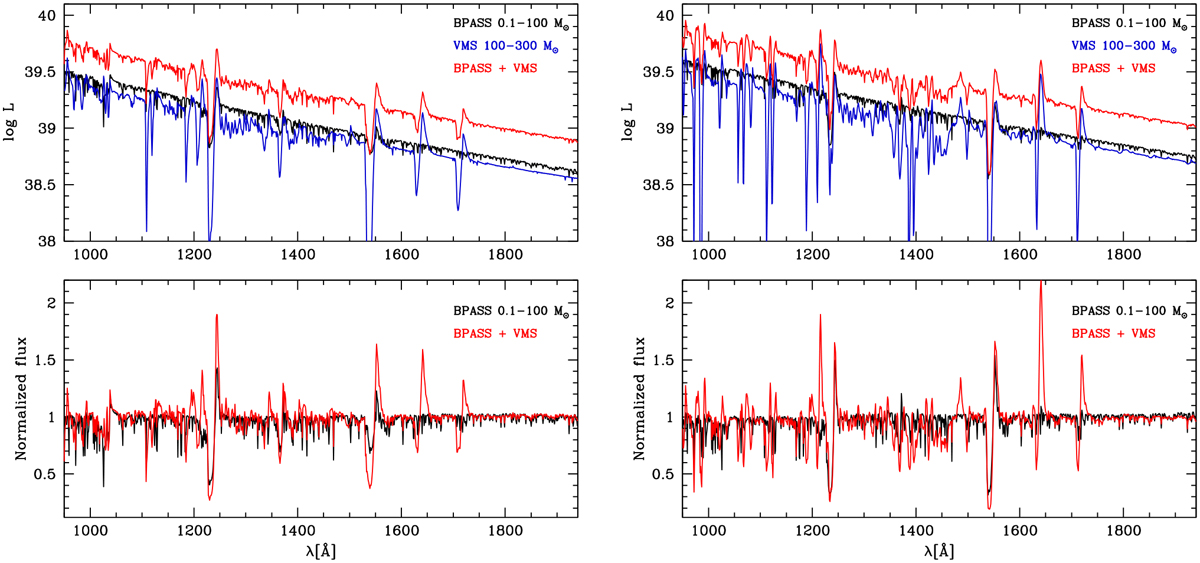
UV spectrum of single-star BPASS population synthesis models at 1 Myr (left panel) and 2 Myr (right panel) shown in black. The blue spectrum is the contribution of stars with masses in the range 100–300 M⊙. The red line is the spectrum of the entire population. In each panel the comparison between the normalized spectrum of the population with (red) and without (black) VMS is shown at the bottom..
Current usage metrics show cumulative count of Article Views (full-text article views including HTML views, PDF and ePub downloads, according to the available data) and Abstracts Views on Vision4Press platform.
Data correspond to usage on the plateform after 2015. The current usage metrics is available 48-96 hours after online publication and is updated daily on week days.
Initial download of the metrics may take a while.