Fig. 1
Download original image
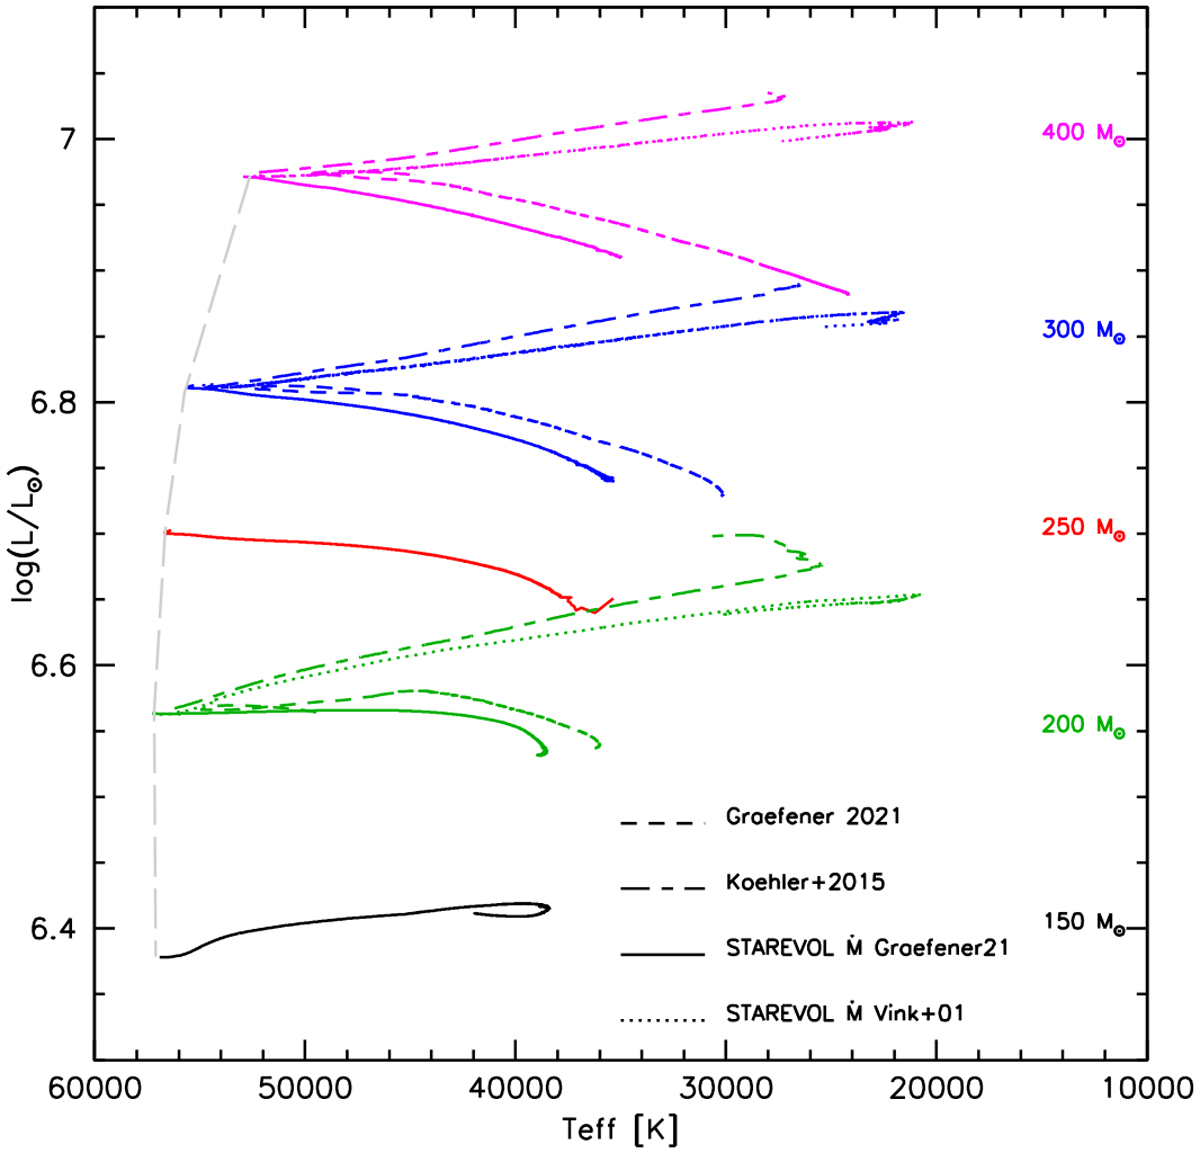
Hertzsprung-Russell diagram (HRD) for our models with two different mass-loss treatments compared to those published in Köhler et al. (2015) and Gräfener (2021). See text for more details. Only the main-sequence part of the tracks up to Xc ≈ 0.01 is shown for all models. The long dashed gray line represents the ZAMS of the STAREVOL models..
Current usage metrics show cumulative count of Article Views (full-text article views including HTML views, PDF and ePub downloads, according to the available data) and Abstracts Views on Vision4Press platform.
Data correspond to usage on the plateform after 2015. The current usage metrics is available 48-96 hours after online publication and is updated daily on week days.
Initial download of the metrics may take a while.