Fig. A.2
Download original image
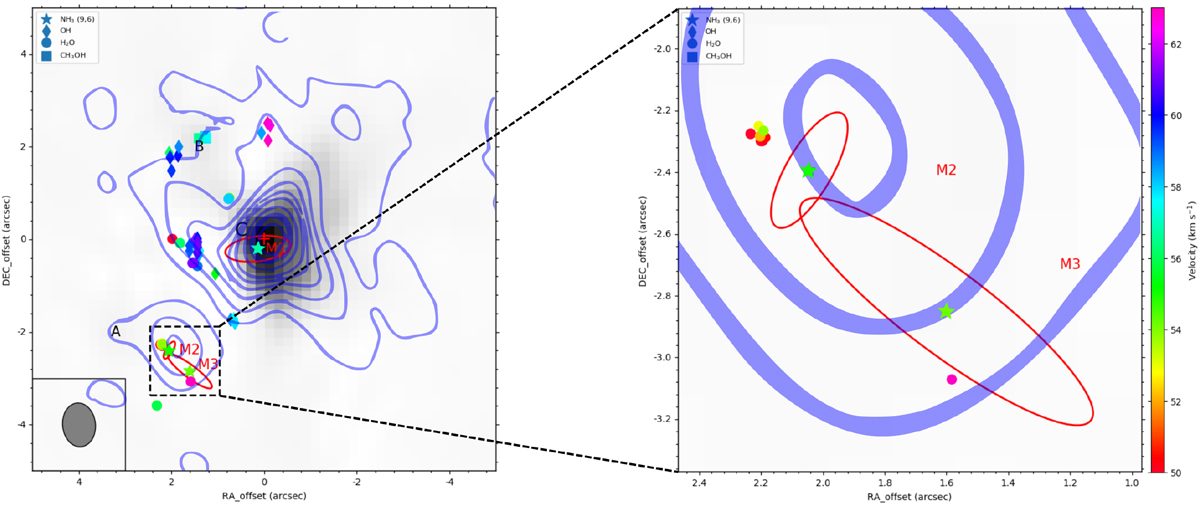
1.36 cm JVLA continuum map of G34.26+0.15 presented as gray shaded areas. The reference position is αJ2000 = 18h53m18s.560, and δJ2000 = 01°14′58′′.201, the peak position, is marked by a red cross. The red ellipses show the positions of NH3 (9,6) emission with stars at their center (i.e., M1, M2, and M3). The blue contours show the Berkeley-Illinois-Maryland Association (BIMA) array 2.8 mm continuum, taken from Mookerjea et al. (2007). Contour levels are -3, 3, 10, 20, 30, 40, 50, 70, 90, 100, 120, and 140 × 20 mJy beam−1. OH (Zheng et al. 2000), H2O (Imai et al. 2011), and CH3OH (Bartkiewicz et al. 2016) masers are presented as diamonds, circles, and squares, respectively. The color bar indicates the velocity range (VLSR) of maser spots.
Current usage metrics show cumulative count of Article Views (full-text article views including HTML views, PDF and ePub downloads, according to the available data) and Abstracts Views on Vision4Press platform.
Data correspond to usage on the plateform after 2015. The current usage metrics is available 48-96 hours after online publication and is updated daily on week days.
Initial download of the metrics may take a while.