Fig. 3
Download original image
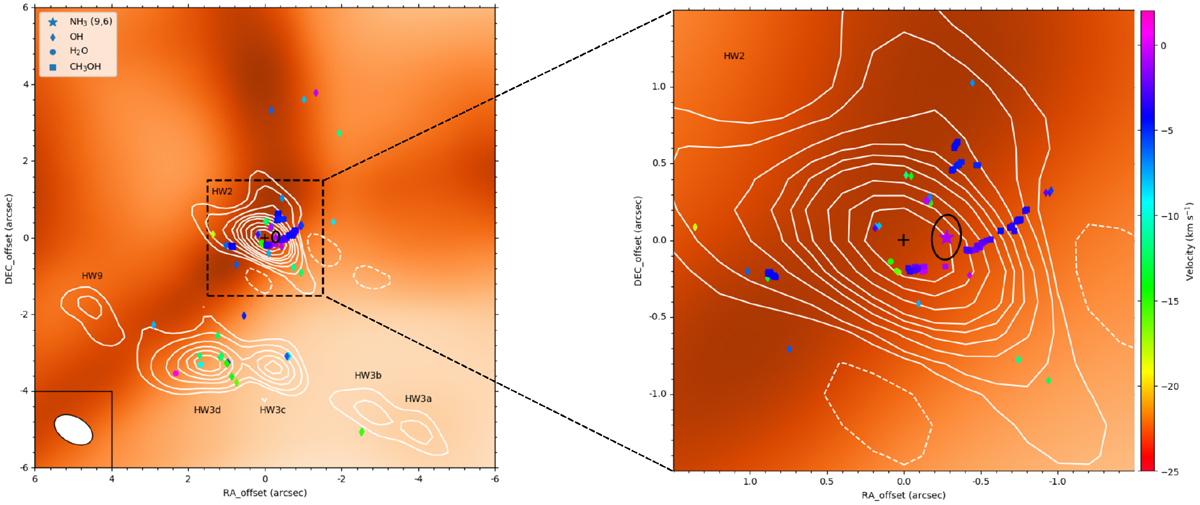
Cepheus A. White contours mark the 1.36 cm JVLA continuum map of Cep A; levels are −5, 5, 10, 20, 30, 40, 50, 70, 90, and 110 × 0.125 mJy beam−1. The background image is the Spitzer 4.5 μm emission, taken from the Galactic Legacy Infrared Mid-Plane Survey Extraordinaire (GLIMPSE; Benjamin et al. 2003; Churchwell et al. 2009). The reference position is αJ2000 = 22h56m17s.972, and δJ2000 = 62°01′49′′.587, the peak position of the continuum map, is marked with a black cross. Slightly to the west of the cross is the black ellipse denoting the position of the NH3 (9,6) emission with a purple star at its center. OH (Bartkiewicz et al. 2005), H2O (Sobolev et al. 2018), and CH3OH (Sanna et al. 2017) masers are presented as diamonds, circles, and squares, respectively. The color bar on the right-hand side indicates the LSR velocity range of the maser spots.
Current usage metrics show cumulative count of Article Views (full-text article views including HTML views, PDF and ePub downloads, according to the available data) and Abstracts Views on Vision4Press platform.
Data correspond to usage on the plateform after 2015. The current usage metrics is available 48-96 hours after online publication and is updated daily on week days.
Initial download of the metrics may take a while.