Fig. 1
Download original image
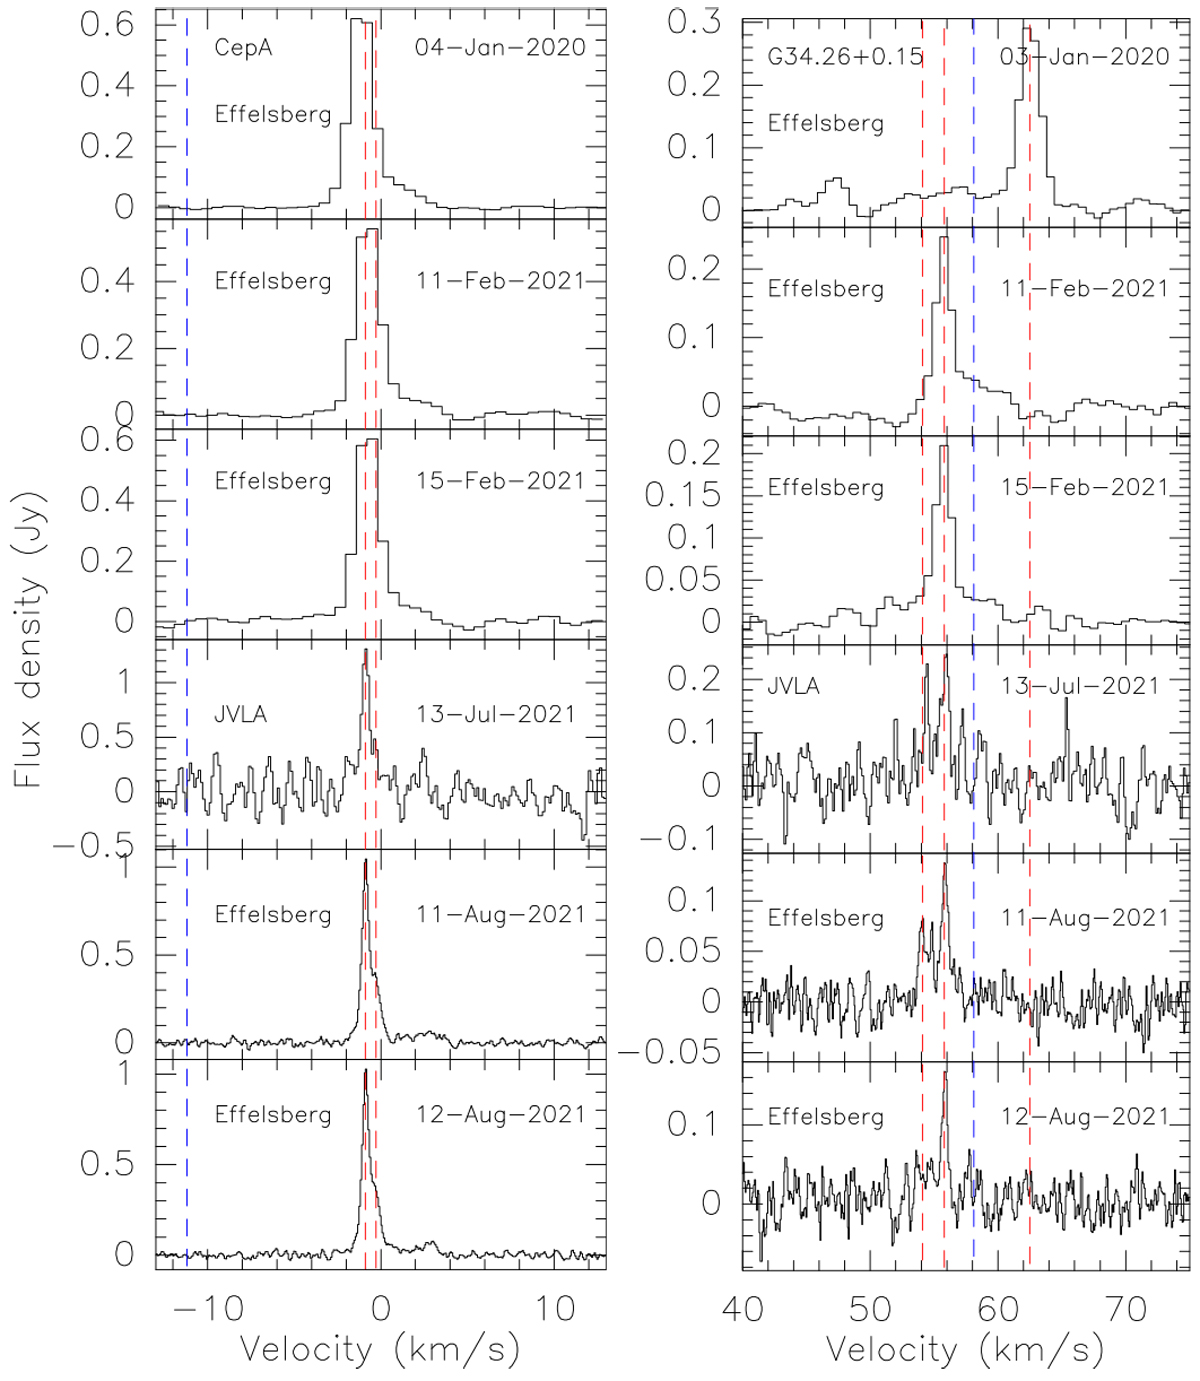
Spectra from NH3 (9,6) transition lines. Left: top to bottom: time sequence of NH3 (9,6) profiles observed toward Cep A with the Effelsberg 100-meter telescope (after subtracting a first-order polynomial baseline). A JVLA spectrum is interspersed. The systemic velocity from CO and HCO+ lines is indicated by a dashed blue line. The two dashed red lines at LSR velocities, VLSR, of −0.90 km s−1 and −0.28 km s−1 indicate the central velocities of the two major components. Right: NH3 (9,6) spectrafrom G34.26+0.15. The systemic velocity from C17O is indicated by a dashed blue line. The three dashed red lines at VLSR = 54.1 km s−1, 55.8 km s−1, and 62.5 km s−1 show the central velocities of the main ammonia emission components.
Current usage metrics show cumulative count of Article Views (full-text article views including HTML views, PDF and ePub downloads, according to the available data) and Abstracts Views on Vision4Press platform.
Data correspond to usage on the plateform after 2015. The current usage metrics is available 48-96 hours after online publication and is updated daily on week days.
Initial download of the metrics may take a while.