Free Access
Fig. A.1
Download original image
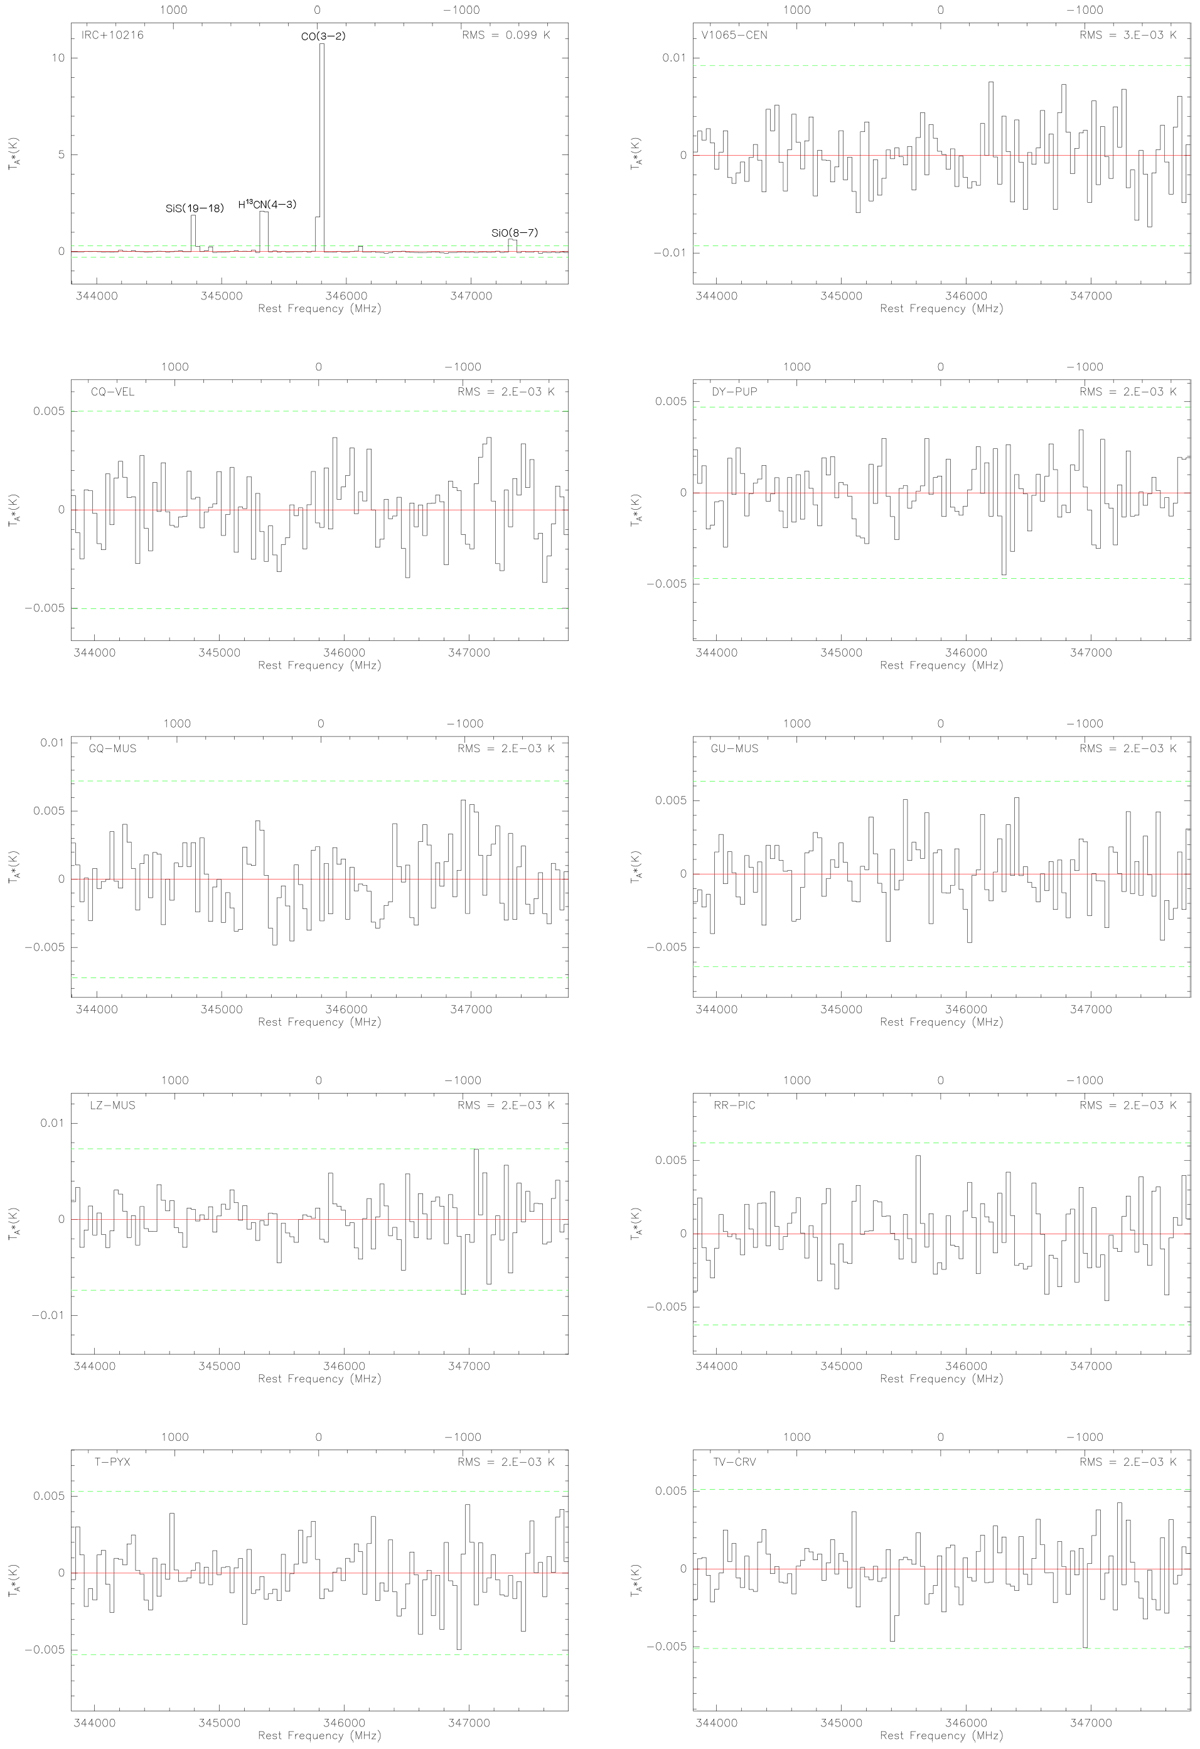
Sample spectra covering the CO(3–2) transition at a resolution of 30 km s−1. The top-left plot shows a reference spectrum of IRC+10216, with its most prominent lines labeled. The velocity scale is given with respect to CO(3–2). The dashed green lines mark 3σ noise levels.
Current usage metrics show cumulative count of Article Views (full-text article views including HTML views, PDF and ePub downloads, according to the available data) and Abstracts Views on Vision4Press platform.
Data correspond to usage on the plateform after 2015. The current usage metrics is available 48-96 hours after online publication and is updated daily on week days.
Initial download of the metrics may take a while.