Fig. 5
Download original image
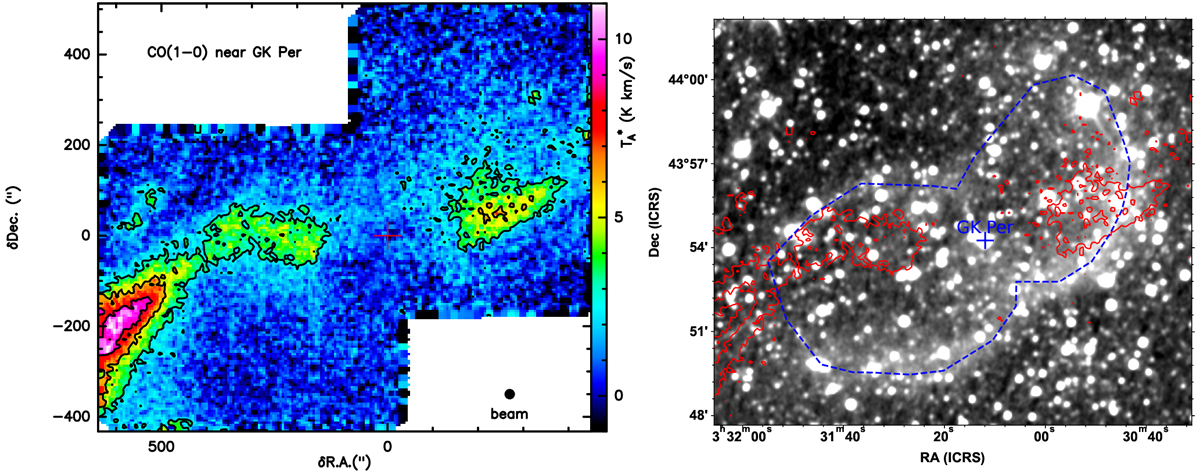
Total-intensity emission of CO(1–0) near GK Per. The cross marks the position of the nova. Contours are at three, six, and nine times the rms noise level. Left: color map of the CO emission. Right: same CO contours plotted as solid red lines over the W2 image of the field (cf. Fig. 4). The CO emission does not follow the dust emission seen in the W2 image.
Current usage metrics show cumulative count of Article Views (full-text article views including HTML views, PDF and ePub downloads, according to the available data) and Abstracts Views on Vision4Press platform.
Data correspond to usage on the plateform after 2015. The current usage metrics is available 48-96 hours after online publication and is updated daily on week days.
Initial download of the metrics may take a while.