Free Access
Fig. 2
Download original image
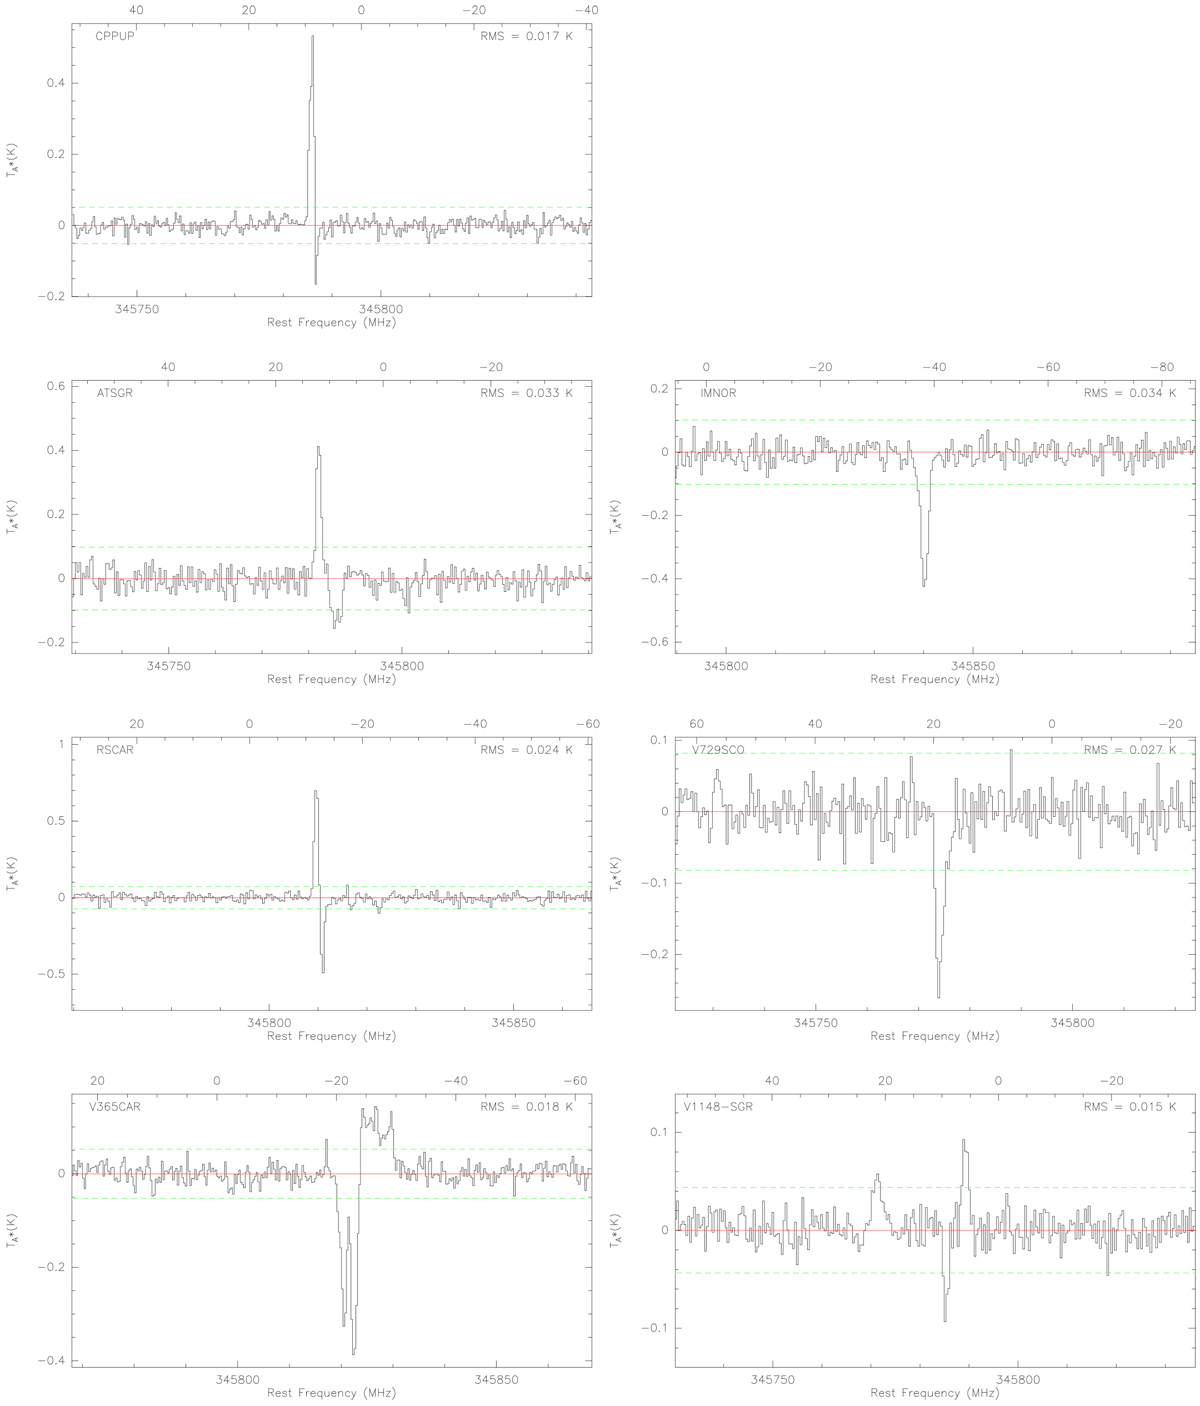
APEX spectra with ISM features of CO(3–2). The top axes give the LSR velocity with respect to the rest frequency of the corresponding CO transition. Dashed lines indicate local 3σ noise levels. The rms values are provided for the baseline outside the ISM features and for the current binning.
Current usage metrics show cumulative count of Article Views (full-text article views including HTML views, PDF and ePub downloads, according to the available data) and Abstracts Views on Vision4Press platform.
Data correspond to usage on the plateform after 2015. The current usage metrics is available 48-96 hours after online publication and is updated daily on week days.
Initial download of the metrics may take a while.