Free Access
Fig. A.5
Download original image
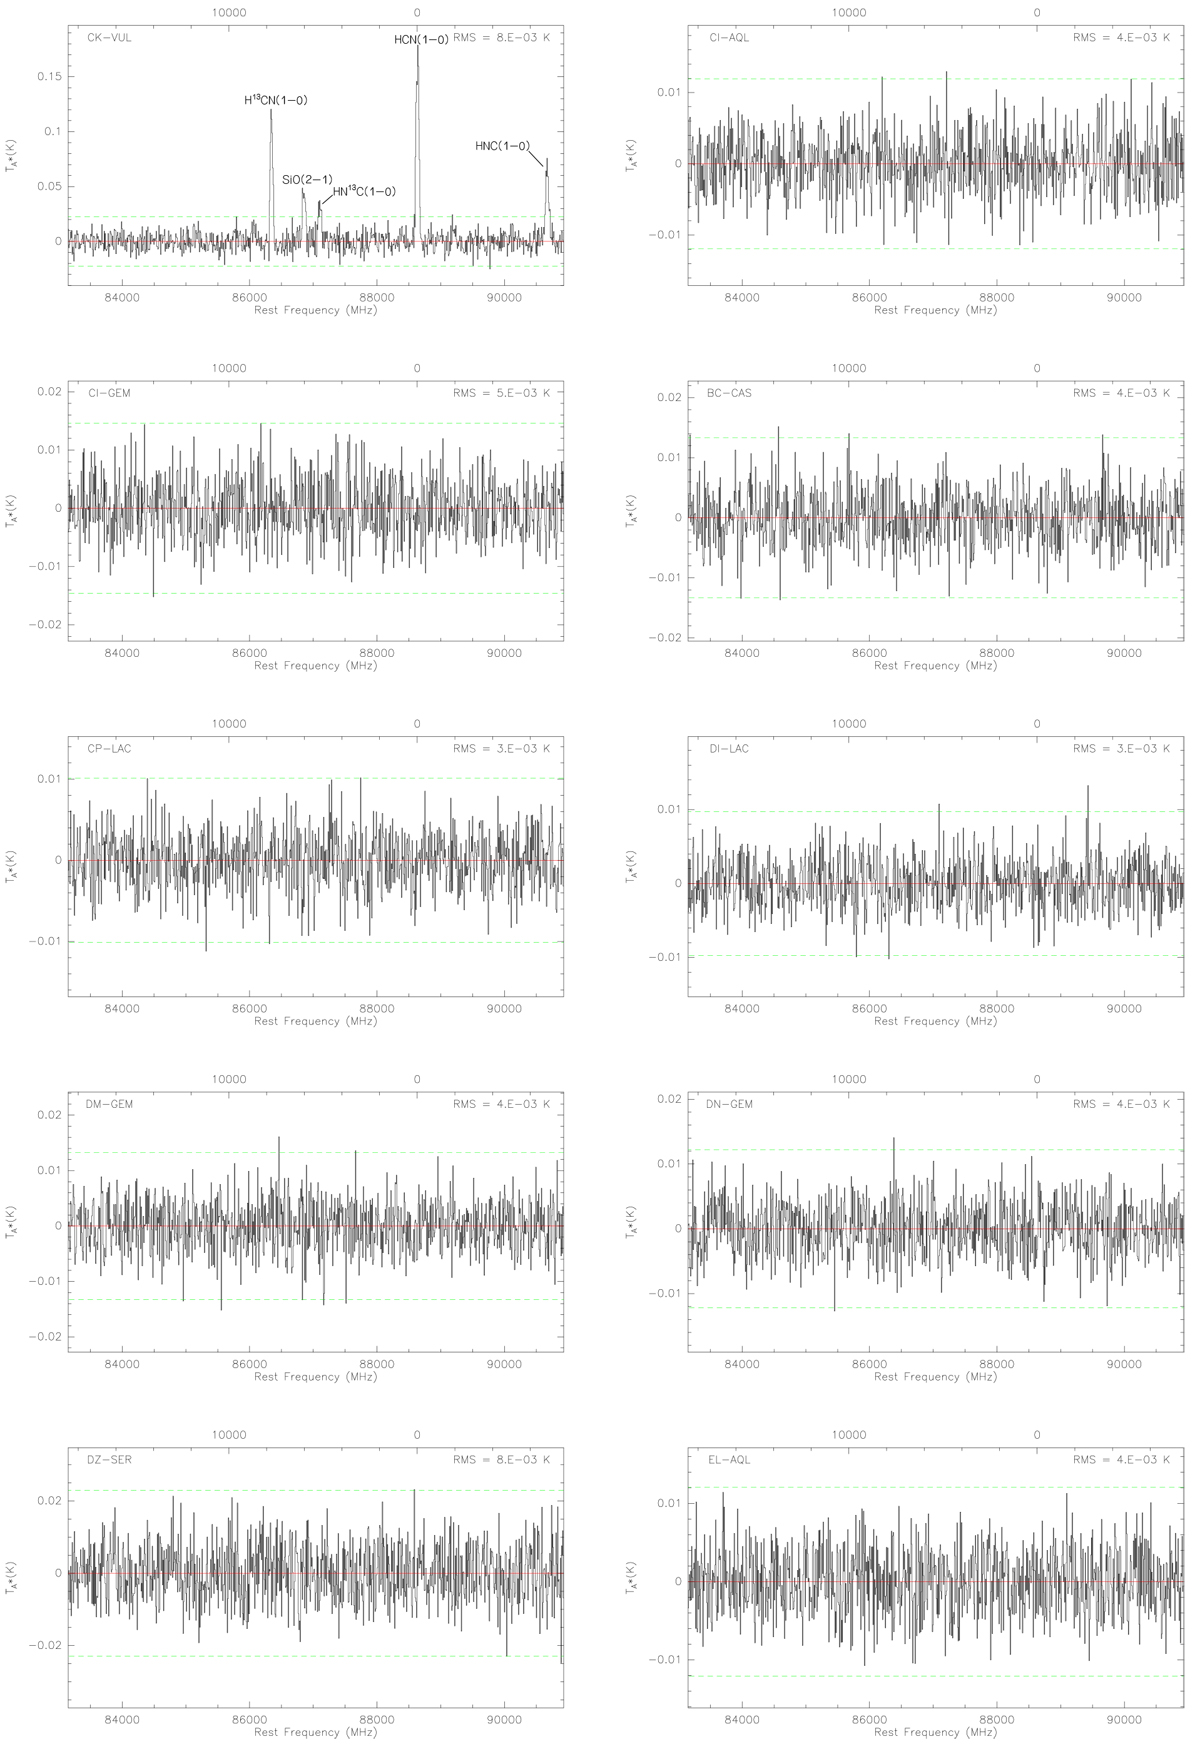
Sample IRAM/FTS spectra covering the HCN(1–0) transition at a resolution of 30 km s−1. The top-leftplot shows a reference spectrum of CK Vul, with its most prominent lines labeled. The top axes give the LSR velocity with respect to the rest frequency of HCN(1–0).
Current usage metrics show cumulative count of Article Views (full-text article views including HTML views, PDF and ePub downloads, according to the available data) and Abstracts Views on Vision4Press platform.
Data correspond to usage on the plateform after 2015. The current usage metrics is available 48-96 hours after online publication and is updated daily on week days.
Initial download of the metrics may take a while.