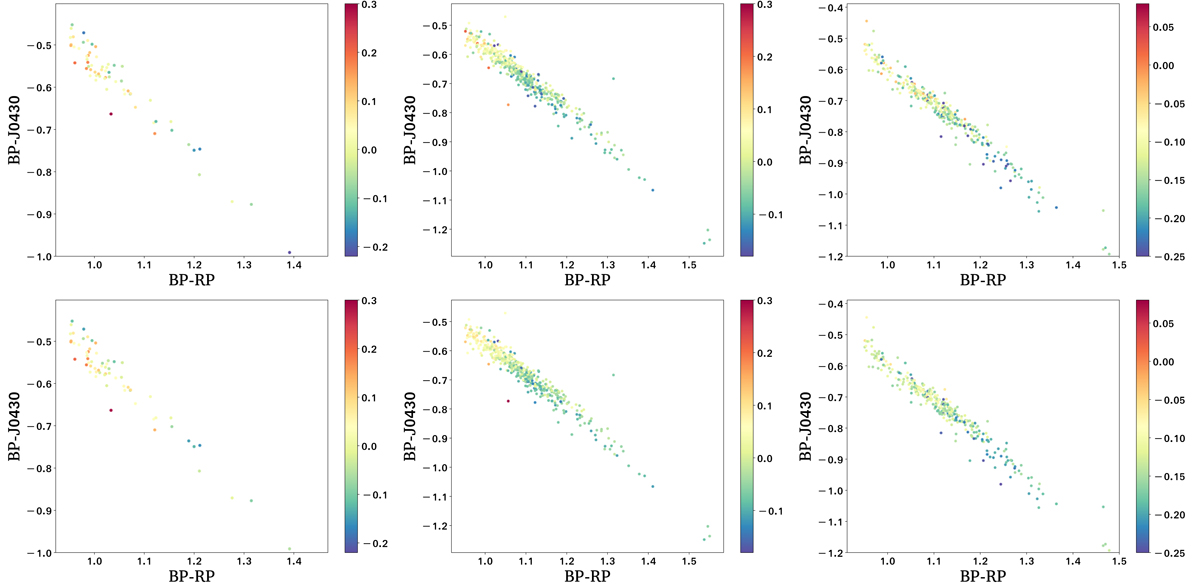
Fig. A.9.
Download original image
Distributions of [C/Fe] in the [BP − RP] – [BP − J0430] colour-colour diagram from the LAMOST DD–Payne (top panels) and the CSNet results (bottom panels) for the training and testing sample giant stars, all colour-coded by [C/Fe]. Different columns are for stars of different [Fe/H] ranges. From left to right these are [−1.2, −0.9], [−0.7, −0.5], and [−0.1, 0.1], respectively.
Current usage metrics show cumulative count of Article Views (full-text article views including HTML views, PDF and ePub downloads, according to the available data) and Abstracts Views on Vision4Press platform.
Data correspond to usage on the plateform after 2015. The current usage metrics is available 48-96 hours after online publication and is updated daily on week days.
Initial download of the metrics may take a while.