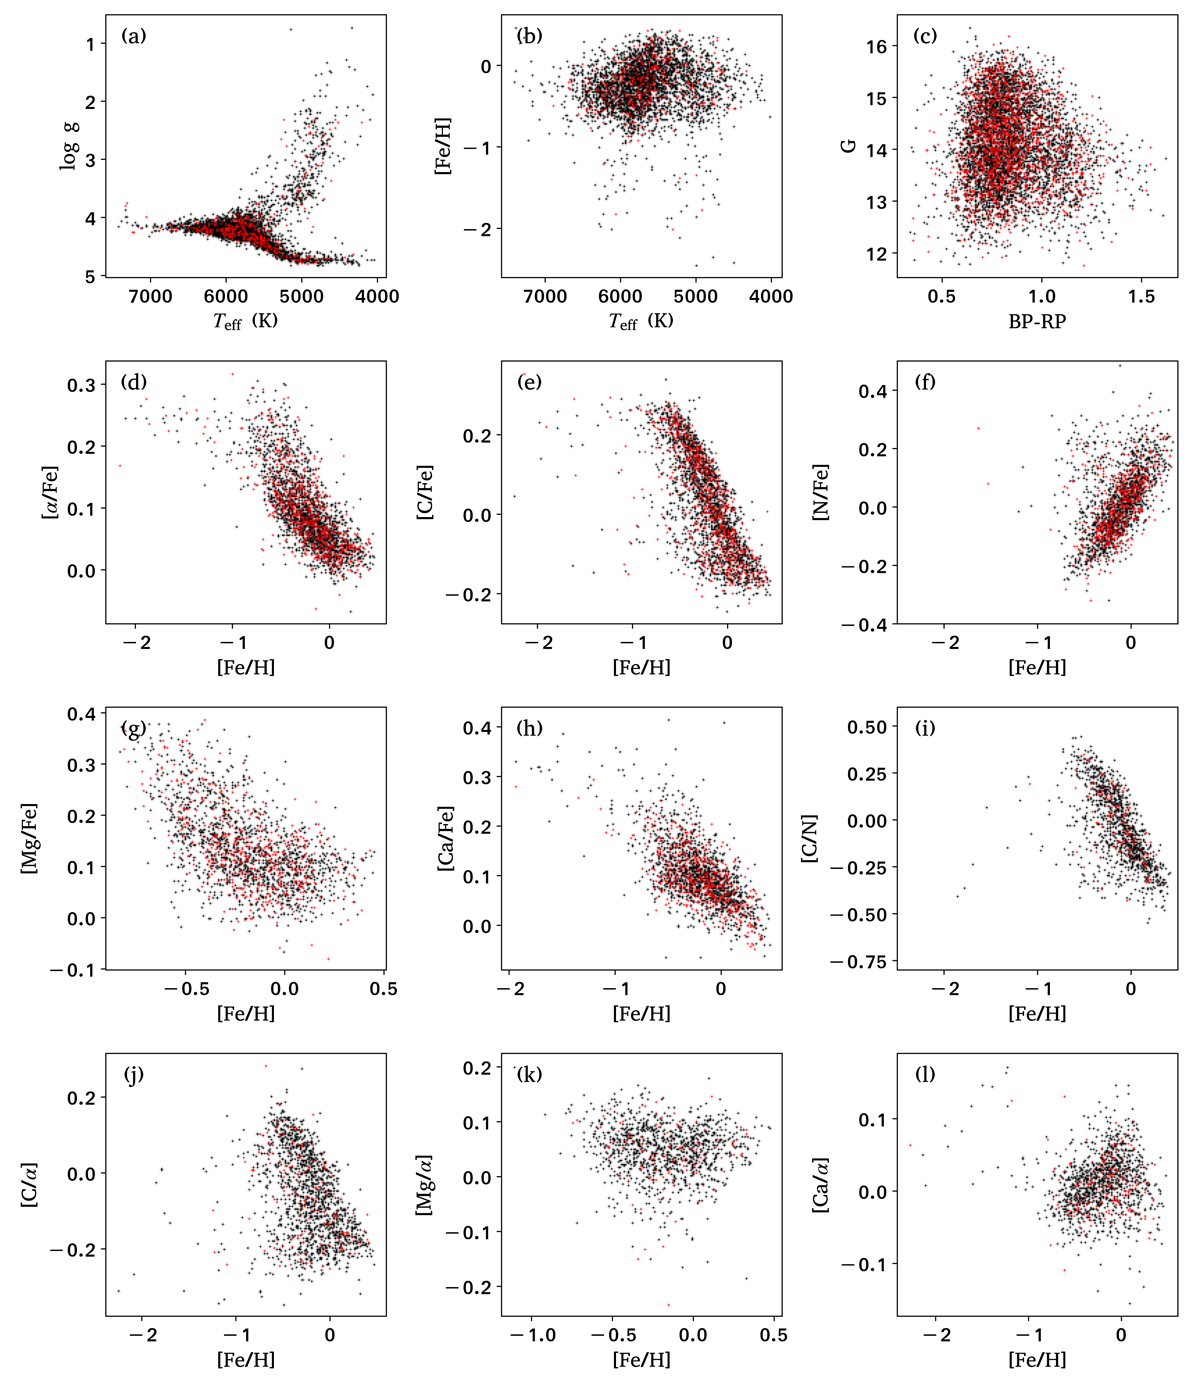
Fig. 1.
Download original image
Distributions of the CSNet training and the testing samples in the planes of Teff–log g, Teff–[Fe/H], [BP–RP]–G, [α/Fe]–[Fe/H], [C/Fe]–[Fe/H], [N/Fe]–[Fe/H], [Mg/Fe]–[Fe/H], [Ca/Fe]–[Fe/H], [C/N]–[Fe/H], [C/α]–[Fe/H], [Mg/α]–[Fe/H], and [Ca/α]–[Fe/H], from top to bottom and left to right. The black and red dots represent the training set and testing set stars, respectively. To avoid crowding, only 10 per cent of the selected stars are plotted.
Current usage metrics show cumulative count of Article Views (full-text article views including HTML views, PDF and ePub downloads, according to the available data) and Abstracts Views on Vision4Press platform.
Data correspond to usage on the plateform after 2015. The current usage metrics is available 48-96 hours after online publication and is updated daily on week days.
Initial download of the metrics may take a while.