Fig. 6
Download original image
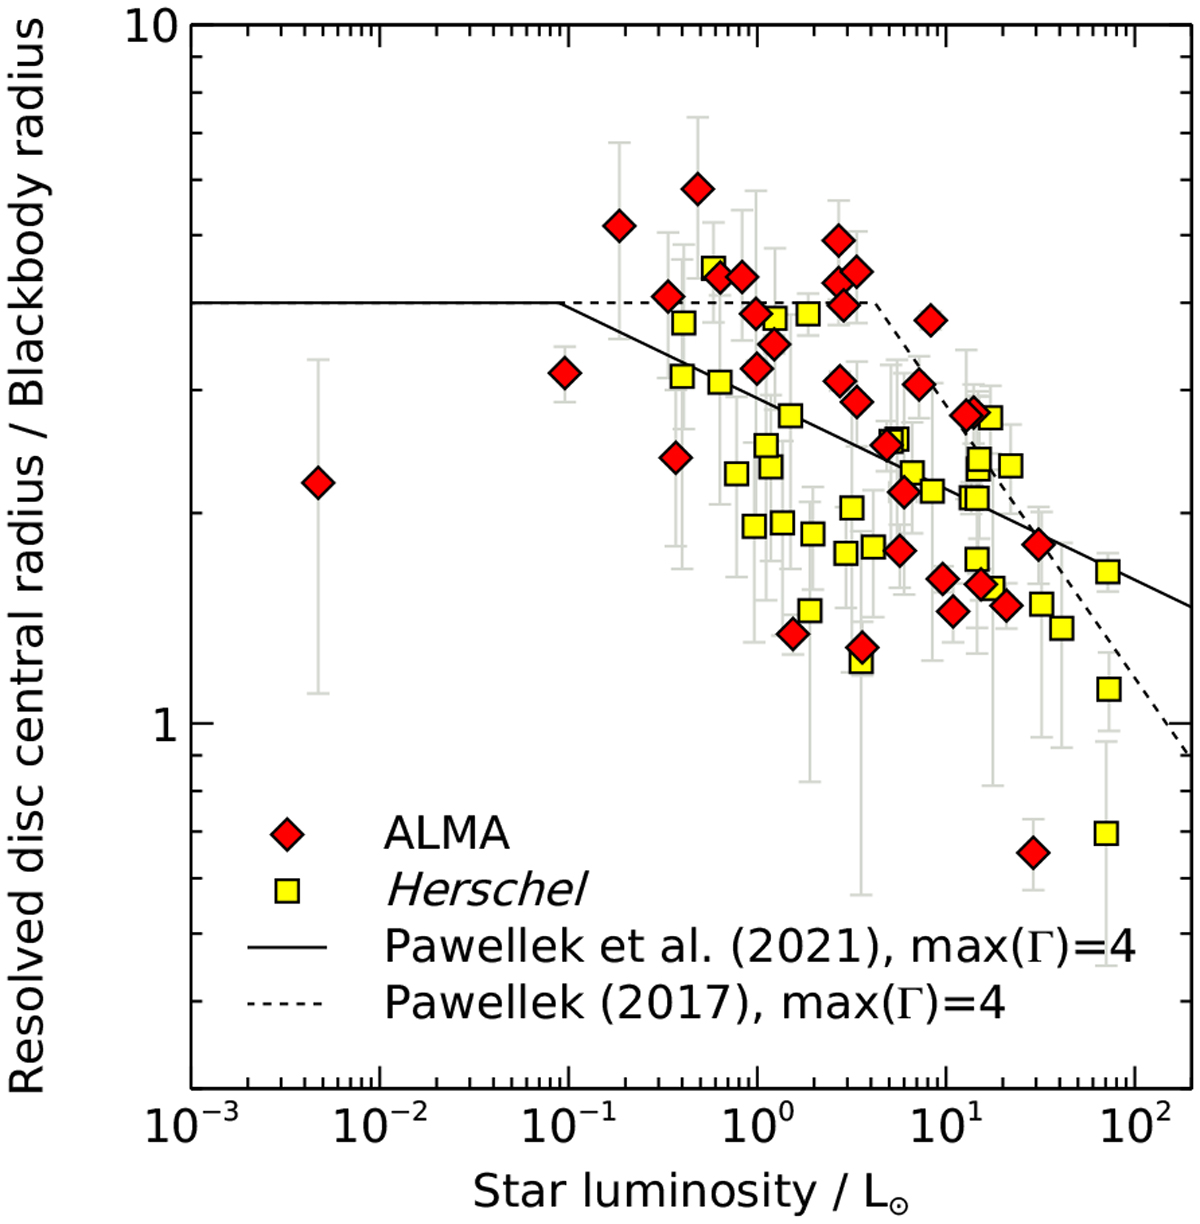
Ratios of resolved debris disc radii to blackbody radii for the systems in our sample, as described in Sect. 2.2.3. Red diamonds and yellow squares show systems where resolved disc radii were derived from ALMA and Herschel data, respectively. Each system is plotted once, using only the best available resolved data as described in Sect. 2.2. The lines show Γ correction factors; the solid line is derived from ALMA data (where we have limited Γ to a maximum of 4) and is that used in this paper (Pawellek et al. 2021), and the dashed line is from Herschel data (Pawellek 2017) as used by Launhardt et al. (2020). We note that the vertical axis uses the central radius of the resolved disc, defined as halfway between pericentre of the disc inner edge and the apocentre of the outer edge. The outlier on the left is the M-type Foma-lhaut C (NLTT 54872). The two systems in the bottom right of the plot may be complicated by either an underestimated cold disc location due to an additional warm component (β UMa: HD 95418; Moerchen et al. 2010) or background contamination (γ Oph: HD 161868; Holland et al. 2017).
Current usage metrics show cumulative count of Article Views (full-text article views including HTML views, PDF and ePub downloads, according to the available data) and Abstracts Views on Vision4Press platform.
Data correspond to usage on the plateform after 2015. The current usage metrics is available 48-96 hours after online publication and is updated daily on week days.
Initial download of the metrics may take a while.