Fig. 5
Download original image
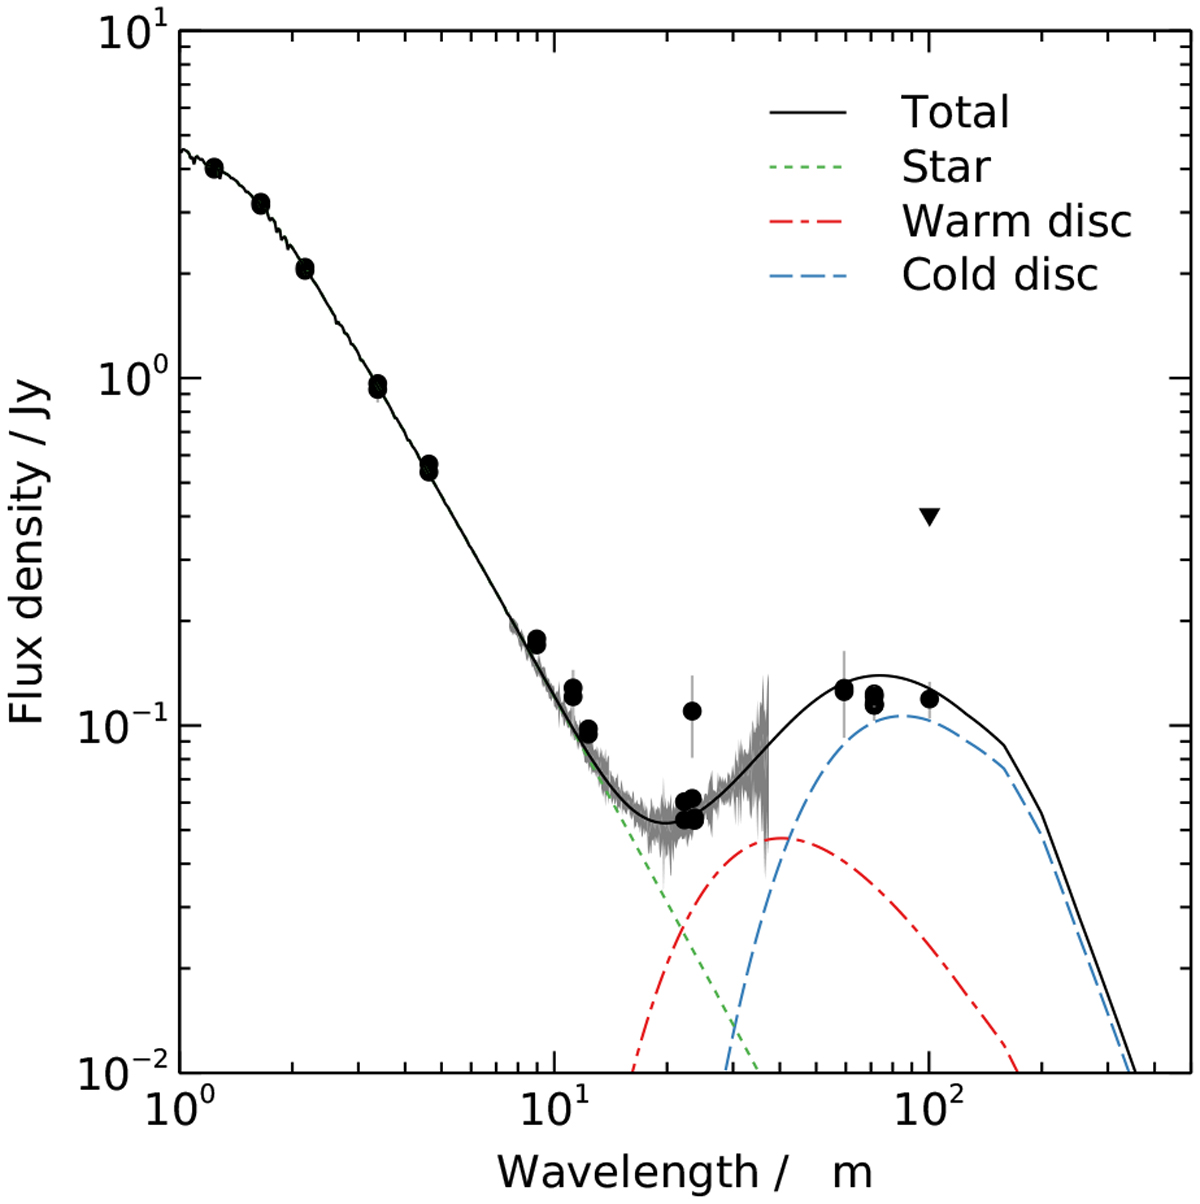
SED data for one example system, HD 37484 (Sect. 2.2.3). Black circles show photometric data, triangles are upper limits, and the grey shaded region is the Spitzer/InfraRed Spectrograph (IRS) spectrum. The best-fit model (black line) comprises the stellar flux (dotted green line) plus additional emission from two debris discs: a cold disc with blackbody temperature 60 ± 7 K (dashed blue line) and a warm disc with blackbody temperature 130 ± 10 K (dash-dot red line). This paper considers only the outermost (cold) discs.
Current usage metrics show cumulative count of Article Views (full-text article views including HTML views, PDF and ePub downloads, according to the available data) and Abstracts Views on Vision4Press platform.
Data correspond to usage on the plateform after 2015. The current usage metrics is available 48-96 hours after online publication and is updated daily on week days.
Initial download of the metrics may take a while.