Fig. 3
Download original image
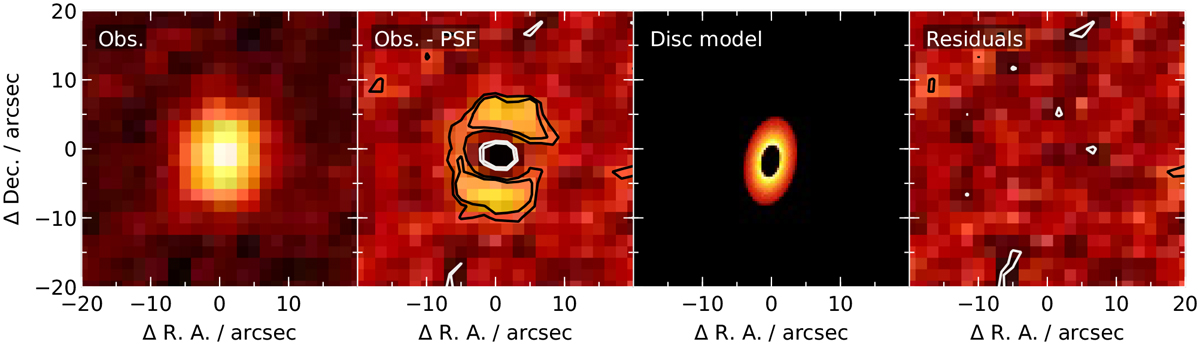
Herschel PACS 100 µm image of HD 1461, as an example of the Herschel data used in this paper (Sect. 2.2.2). North is up, and east is left. From left to right, the plots show the observation, observation after PSF subtraction, best-fitting disc model, and residuals after model subtraction. Contours show ±2 and ±3 times the root-mean-square intensity. Whilst the disc is resolved, it clearly has a lower resolution than the example ALMA image in Fig. 2. Our Herschel disc models are axisymmetric; the offset between the disc model and the origin reflects the imperfect Herschel pointing rather than a physical offset between the disc and the star.
Current usage metrics show cumulative count of Article Views (full-text article views including HTML views, PDF and ePub downloads, according to the available data) and Abstracts Views on Vision4Press platform.
Data correspond to usage on the plateform after 2015. The current usage metrics is available 48-96 hours after online publication and is updated daily on week days.
Initial download of the metrics may take a while.