Fig. 15
Download original image
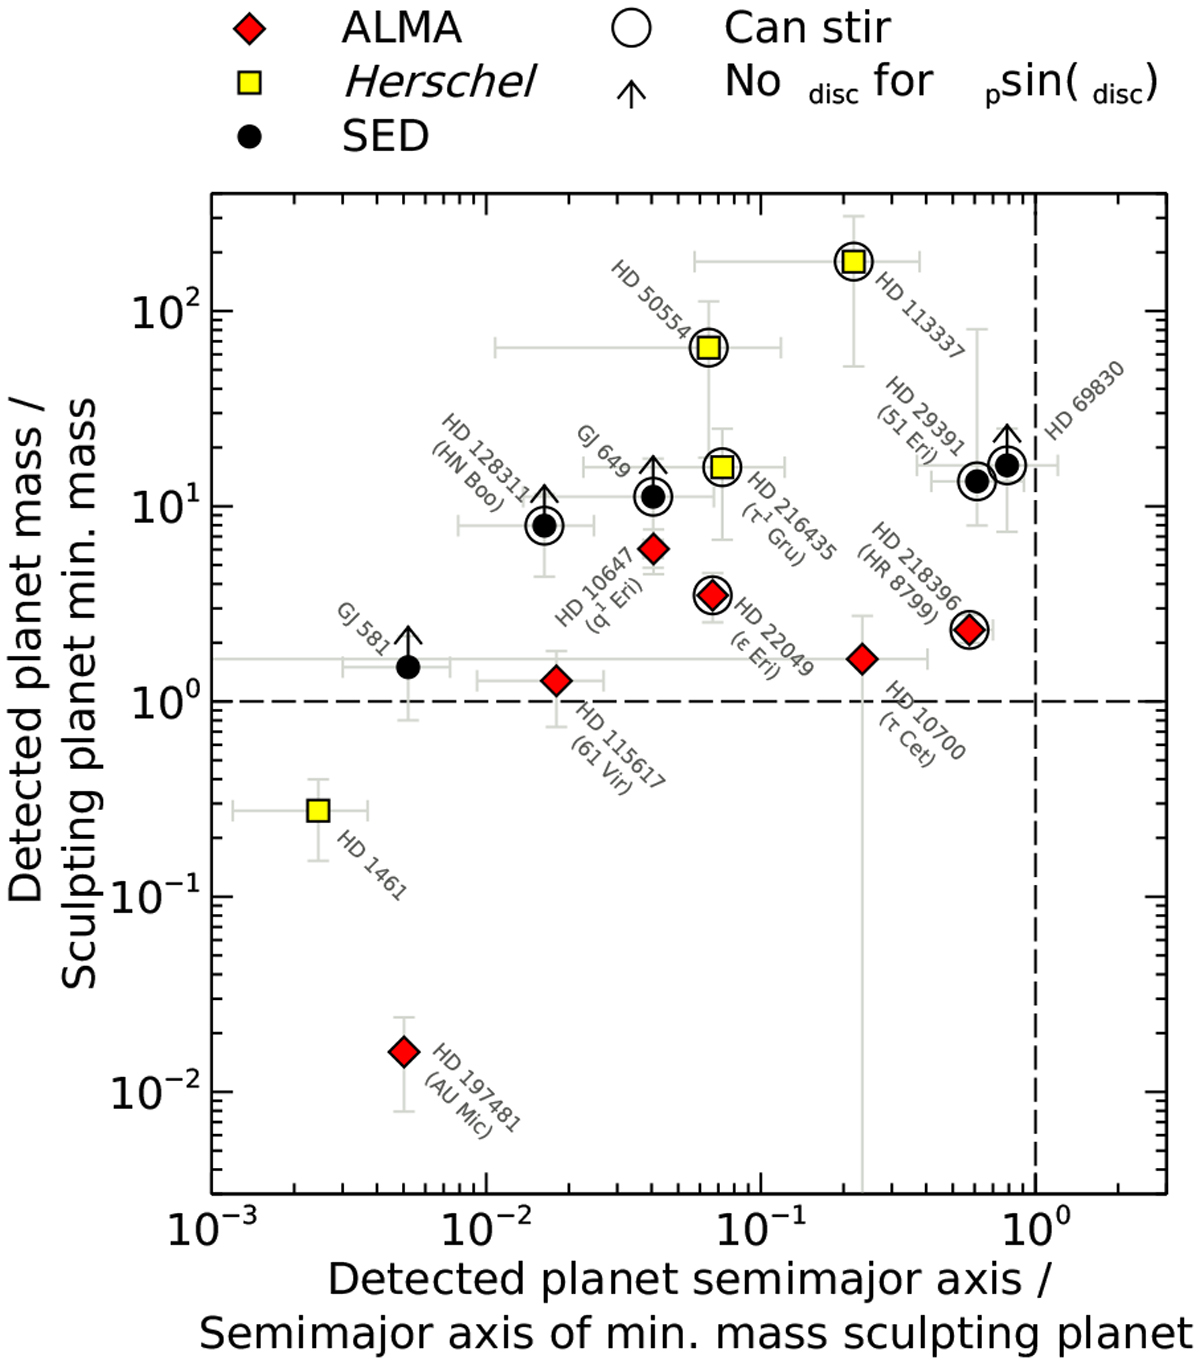
Comparison of detected and predicted planets in our debris disc systems, as described in Sect. 5.1.2. For systems with a detected planet, the vertical axis shows the mass of one detected planet divided by the mass required by a single planet to sculpt the disc inner edge (Sect. 3.1). We calculate the masses of RV planets by assuming that they are copla-nar with the discs. The horizontal axis shows the semimajor axis of the detected planet, divided by the semimajor axis that the minimum-mass sculpting planet would have. For systems with multiple known planets, only the outermost detected planet is shown. Dashed lines denote unity. With the possible exceptions of 51 Eri (HD 29391) and HD 69830, the detected planets are unlikely to be massive enough to sculpt the disc inner edges in situ; whilst some are larger than the minimum masses required for sculpting, these detected planets lie far interior to the discs and so would need significantly greater masses to sculpt the discs in situ (line 4 on Fig. 7). This means that either additional undetected planets also reside in these systems, or the known planets formed in the outer regions and rapidly sculpted the discs before migrating inwards. Conversely, some detected planets are massive enough to have stirred the discs in situ, despite their smaller semimajor axes; systems where detected planets could stir the discs are circled. Arrows show lower limits on detected planet masses for RV planets with no disc inclination data, and the remaining symbols were defined on previous figures.
Current usage metrics show cumulative count of Article Views (full-text article views including HTML views, PDF and ePub downloads, according to the available data) and Abstracts Views on Vision4Press platform.
Data correspond to usage on the plateform after 2015. The current usage metrics is available 48-96 hours after online publication and is updated daily on week days.
Initial download of the metrics may take a while.