| Issue |
A&A
Volume 659, March 2022
|
|
|---|---|---|
| Article Number | L5 | |
| Number of page(s) | 6 | |
| Section | Letters to the Editor | |
| DOI | https://doi.org/10.1051/0004-6361/202142694 | |
| Published online | 04 March 2022 | |
Letter to the Editor
Direct measurement of the distribution of dark matter with strongly lensed gravitational waves
1
Department of Astronomy, Beijing Normal University, 100875 Beijing, PR China
e-mail: caoshuo@bnu.edu.cn, zhuzh@bnu.edu.cn
2
Advanced Institute of Natural Sciences, Beijing Normal University at Zhuhai, Zhuhai 519087, PR China
3
Department of Physics, College of Sciences, Northeastern University, Shenyang 110004, PR China
4
National Centre for Nuclear Research, Pasteura 7, 02-093 Warsaw, Poland
5
School of Science, Chongqing University of Posts and Telecommunications, Chongqing 400065, PR China
Received:
18
November
2021
Accepted:
15
February
2022
In this Letter, we present a new idea of probing the distribution of dark matter exhibiting elastic and velocity-independent self-interactions. These interactions might be revealed in multiple measurements of strongly lensed gravitational waves, which can be observationally explored to determine the strength of self-scatterings. Specifically, each individual galactic-scale strong-lensing system whose source is a coalescing compact binary emitting gravitational waves will provide a model-independent measurement of the shear viscosity of dark matter along the line of sight. These individual measurements could be a probe of large-scale distribution of dark matter and its properties. Our results indicate that with 10–1000 strongly lensed gravitational waves from ET and DECIGO, robust constraints on the large-scale distribution of self-interacting dark matter might be produced. More stringent limits on the dark matter scattering cross-section per unit mass (σχ/mχ) relevant to galaxy and cluster scales are also expected, compared with the conservative estimates obtained in the electromagnetic domain. Finally, we discuss the effectiveness of our method in the context of self-interacting dark matter particle physics.
Key words: gravitational lensing: strong / dark matter / gravitational waves
© ESO 2022
1. Introduction
It is well known that dark matter (DM) – the dominant component of virialized objects (galaxies and clusters) – is one of the largest open questions in modern astrophysics. Especially the collisionless cold DM (CCDM), which is widely recognized by the astrophysics community and strongly supported by the current observations of large-scale structures (e.g. galaxy clusters), follows the homogeneous and isotropic distribution in the Universe (Schaye et al. 2015; Springel et al. 2018). However, the CCDM paradigm still suffers from the well-known small-scale problem that concerns some observed features of galaxies and dwarf galaxies (e.g., missing satellite, core-cusp, or too-big-to-fail problems) (Read et al. 2017). Interestingly, there are suggestions that self-interacting (SI) DM (SIDM) might successfully explain these discrepancies. This provides an interesting alternative clue for the current cosmological model (Tulin & Yu 2018). Many ideas have been proposed to explore the possibilities that DM SI might generate cosmic accelerated expansion (Zimdahl et al. 2001; Cao et al. 2011) and non-zero cosmological shear viscosity (Hawking 1966). More interestingly, SIDM with velocity-dependent SI has gathered growing attention because it can provide a consistent fit on the scattering cross sections per unit mass that is applicable to different scales (Hayashi et al. 2021). Despite these advantages, the nature of SIDM remains unknown. It is in particular still debated whether SIDM traces CCDM in the Universe because no direct detection of its distribution has been performed.
According to General Relativity, absorption and dispersion of gravitational waves (GWs) could be neglected in a perfect-fluid Universe (Ehlers & Prasanna 1996). This theoretical point of view has been widely applied in some recent works (Qi et al. 2019). However, the hypothesis of transparent GWs in the EM domain remains untested experimentally (Abbott et al. 2016). In this Letter, we propose a new idea of measuring the properties of DM with elastic and velocity-independent SI through the multiple measurements of galactic-scale strong gravitational lensing systems with neutron star (NS) mergers acting as background sources. The advantage of our method is that (I) viscously damped gravitational waves from these standard sirens would reach the observer, accompanied by the electromagnetic radiation in the form of short and intense bursts of γ rays (Abbott et al. 2017). (II) Each individual GW – galaxy strong-lensing system will provide a model-independent measurement of the fluid shear viscosity of dark matter along the line of sight. Therefore, with a sample of viscosity measurements at different positions on the sky, the distribution of dark matter in the Universe might be tested directly. (III) The strongly lensed NS-NS systems are ideal laboratories for deriving robust constraints on the scattering cross sections per unit mass relevant for different scales, from ultra-dwarf galaxies to relaxed galaxy clusters.
2. Method
The LIGO and Virgo Collaborations have so far released the measurements of luminosity distances for 90 GW sources (The LIGO Scientific Collaboration et al. 2021). However, we stress that the luminosity distances DL, obs were derived from the observed strain h(t) and frequency evolution f(t) under the assumption that DM in the Universe is treated as a perfect fluid. On the other hand, if the DM can be better represented as a non-ideal fluid characterized by a shear viscosity term η, then the relation  between the GW damping rate (β) and DM viscosity (η) is simple. This relation, which was originally proposed in Hawking (1966) with the c = 8πG = 1 convention, was also derived in the framework of geometric units (Ehlers & Prasanna 1996; Atreya et al. 2018). In this analysis, we reintroduce the fundamental constants in the formulae. Considering the inverse relation between the amplitude of GW waveform and the luminosity distance, when the GW damping rate is taken into account, the viscosity-free luminosity distance (DL) inferred from the standard siren GW signal is modified to
where DL, eff and D represent the so-called effective luminosity distance and comoving distance, respectively (Goswami et al. 2017; Cao et al. 2021). More recently, a method of measuring the viscosity of DM in the cosmological context has been suggested and implemented for the currently 11 GW events that were released by LIGO and Virgo Collaborations (Lu et al. 2018). However, a number of concerns were also raised about the robustness of the above test: precise measurements of distances that are unaffected by viscosity in the light of problems with host galaxy identification and redshift determination for coalescing binary black holes (BH) are not available. This motivates the search for other methods to probe the DM viscosity. In this Letter we propose strongly lensed GWs produced by coalescing NSs for this purpose.
As one of the successful predictions of General Relativity, strong gravitational lensing by galaxies has become one of the most important tools in studying cosmology (Cao et al. 2015) and the galaxy structure and evolution (Cao et al. 2016). With the dawn of GW astronomy, the robust prediction suggested that a considerable number of GW signals from inspiralling NSs would be gravitationally lensed, focusing on the third generation of ground-based GW detectors (Ding et al. 2015) and on the second generation of space-based GW detectors (Piórkowska et al. 2021), respectively. In this Letter, our idea relies on the derived multiple distances in a specific strong-lensing system (with the background GW source at redshift zs and the lensing galaxy at redshift zl), with strongly lensed GW signals observed together with their electromagnetic (EM) counterparts. We outline below three approaches to measure the angular diameter distances between the observer and the lens (DA(zl)), between the observer and the source (DA(zs)), and between the lens and the source (DA(zl, zs)).
Firstly, with the measurements of the central velocity dispersion and the location of multiple images (Einstein radius) of a strong-lensing system, the ratio of two angular diameter distances DA(zl, zs)/DA(zs) can be precisely assessed. Specifically, by assuming a power-law model to describe the lens mass distribution (ρ ∼ r−γ), the lens potential relates to the moments of the stellar distribution function through the Jeans equation (Koopmans et al. 2005). The combination of the lens mass and the dynamical mass inside the Einstein radius (θE) yields (Cao et al. 2015)
where the luminosity-averaged velocity dispersion σap is measured within the aperture θap (see Cao et al. 2015 for the expression of f(γ) in the form of the radial mass profile slope). Therefore, the observations of σap, θE, θap, and γ enables precise measurements of the distance ratio DA(zl, zs)/DA(zs). Secondly, the time-delay distance in a specific GW – galaxy strong-lensing system can be measured. The time-delay distance is defined as
It could be measured precisely and accurately for transient sources such as GW signals from coalescing binaries through the precise measurement of the time delay and the well-reconstructed Fermat potential difference (Δϕi, j) between multiple images, that is, the multiple GW signals. The EM counterpart would allow the host galaxy and lens galaxy identification, and dedicated lens modelling techniques would enable a precise reconstruction of the lens mass distribution. More importantly, the time difference (Δti, j) in the arrival times of two signals (at angular coordinates θi and θj on the sky) can also be measured with unprecedented accuracy (Liao et al. 2017). We stress that lensing time delays are not affected by GW damping effect due to DM viscosity. This advantage of strongly lensed GW signals has been widely discussed in fundamental physics (Collett & Bacon 2017) and cosmology (Cao et al. 2019). Now, the angular diameter distance to the lens can be calculated as
We note that based on the Etherington reciprocity relation, which is of fundamental importance in modern cosmology (Etherington 1993), combined with distance sum rule, the luminosity distance to the source can be expressed as

which is unaffected by GW damping effect and DM SIs. Thirdly, another advantage of strongly lensed GW events comes from their ability to provide simultaneous measurements of the effective luminosity distance to the source, that is, coalescing binary NSs can be calibrated as standard sirens. However, due to the magnification effect of lensing, the luminosity distance measured from the strongly lensed GW signals is not the true DL, eff, but rather DL, eff/A, where A is the lensing amplification factor. If the lensing magnification μ could be independently measured through photometric EM observations, we would be able to correct the amplitude of the GW signal for the amplification factor  . Therefore, the true effective luminosity distance from the observer to the source, which is affected by viscous DM damping, could be derived as

based on a detailed analysis of the images of the host galaxy and the accompanying EM counterpart.
The function β(zl, zs) can now be directly obtained through the combined analysis with Eqs. (2)–(5) for individual lenses. This general function is applicable to any form of SIDM along the line of sight. In the following section, we apply this method to the simulated data of future ground-based and space-based GW detectors.
3. Simulated data and constraints
A particular single strong-lensing system possesses its own sensitivity to DM viscosity. The recent analysis of Cutler & Holz (2009) revealed that the DECIGO, a proposed space-based GW detector, can discover up to 1000 lensed GW events in the accumulated data of five to ten years. This is an improvement of more than one order of magnitude over the three nested ET interferometers in the redshift range z ≤ 5.00 (Li et al. 2018). Following the approach proposed by Collett (2015), we have simulated a realistic population of strongly lensed GWs (10 and 1000 events in ET and in DECIGO, respectively), the sampling distribution of which follows the intrinsic merger rate of double compact objects (DCO) calibrated by strong-lensing effects (Ding et al. 2015). The lensed GW systems are randomly sampled on the sky, with the masses of the NSs uniformly sampled in the interval of [1 M⊙, 2 M⊙]. The number density of lenses, assumed to have a Gaussian distribution of the central velocity dispersion similar to the SL2S sample (σ0 = 210 ± 50 km s−1) (Sonnenfeld et al. 2013), is characterized by the velocity dispersion function (VDF) of early-type galaxies from SDSS DR5 (Choi et al. 2007). Based on the uncertainties of multiple measurements in strongly lensed gravitational waves (see the appendix for details), we numerically propagated the uncertainties of different observables (time delays, mass density profile, Einstein radius, velocity dispersion, line-of-sight contamination, etc.) to the uncertainty of different distances, and finally to the uncertainties of the DM viscosity on which it depends.
Following the method outlined above, we show the measurements of β(zl, zs) expected to be detected by future ET and DECIGO in Fig. 1. Our simulation is based on the concordance ΛCDM model (collisionless CDM) with the parameters determined by Planck 2018 data (Aghanim et al. 2020).
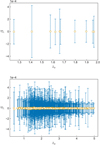 |
Fig. 1. Individual measurements of the damping rate of gravitational waves based on future observations of strongly lensed NS-NS systems from ET (upper panel) and DECIGO (lower panel). |
The question now is whether these measurements are sufficient to trace the distribution of DM and its properties. We find that both ET and DECIGO would provide precise 3D measurements of the GW damping rate β(z) and DM viscosity η(z) at different redshifts and different positions on the sky. The significant discrepancy between these individual measurements could be a probe of the large-scale distribution of DM and its properties. In particular, the second-generation space-based detectors (e.g. DECIGO) would provide a catalog of more precise β(z) measurements that would be larger by one order of magnitude. This would increase the possibility of determining different β(zl, zs) for different pairs (zl, zs). Summarizing the multiple β measurements through the inverse-variance weighting, a constraint on the β parameter at the precision of Δβ = 10−4 Mpc−1 might be expected, with ten multi-messenger strongly lensed GW events from ET. For comparison, we also considered the constraining power of the same technique in space-borne detectors, using simulated data representative of the future observations of lensed GW and EM signals. The result is shown in Fig. 2. Lensed systems seen jointly in GW and EM signals by DECIGO give much more stringent constraints, the uncertainty of the damping of GWs in a viscous Universe being Δβ = 10−6 Mpc−1. This can be understood because the number of strongly lensed standard sirens as well as of precise distance measurements at much higher redshifts is higher. We note that statistically significant differences between particular strong-lensing systems can be used to distinguish between DM and modified gravity. Namely, as discussed for instance in some classes of modified gravity theories (Belgacem et al. 2018a,b; Mastrogiovanni et al. 2020), GW propagation involves a friction term. In consequence, GW amplitude is attenuated in a similar manner as by DM shear viscosity. However, this effect should be isotropic, while differences in DM distribution along the line of sight could manifest themselves as discussed in this section.
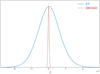 |
Fig. 2. Fits on the damping rate of GWs based on strongly lensed NS-NS systems from ET and DECIGO. |
Now the main question now is whether this accuracy is enough to distinguish between possible DM shear viscosity and SI cross-sections necessary to solve CCDM problems at galaxy and cluster scales. SIDM is parametrized by the scattering cross-section per unit mass (σχ/mχ), which is generally a function of the relative velocity of the DM particles (χ) (Tulin & Yu 2018; Atreya et al. 2018),
In particular, because the collision rate becomes negligible in low-density regions, SIDM particles behave like collisionless CDM at larger length scales. These newly proposed velocity-dependent SIs provide a consistent fit to the CDM paradigm at different scales, provided σχ/mχ ∼ 1 cm2 g−1 on the scale of galaxies (Dooley et al. 2016) and σχ/mχ ∼ 0.1 cm2 g−1 on the scale of galaxy clusters (Markevitch et al. 2004). However, the class of velocity-dependent SIDM models remains largely unconstrained. Similarly, in this paper, two SIDM scenarios are also considered with our method, with the phenomenological SIDM halo model proposed in Kaplinghat et al. (2016). More specifically, focusing on galactic-scale DM halos, ten lensed GWs detected by ET will provide a stringent limit on its SI cross section as
A much stronger limit on the DM SI cross section,
can be obtained with 1000 lensed GW events detected by DECIGO. Previously, by analyzing the rotation curves of five dwarf galaxies in the THINGS sample (Oh et al. 2011) and seven LSB galaxies from Kuzio et al. (2008), Kaplinghat et al. (2016) derived a limit on the cross section Δ(σχ/mχ)∼5 × 10−1 cm2 g−1 for all 12 galaxies. In the present paper, using 10–1000 strongly lensed GWs from the third-generation ground-based GW detectors and space-based detectors, our constraints are 103 ∼ 105 times tighter than the results obtained before. For the cluster-scale case, the limits we derive here are Δ(σχ/mχ)∼10−5 cm2 g−1 and Δ(σχ/mχ)∼10−7 cm2 g−1 in the framework of ET and DECIGO, respectively. Therefore, we could obtain very optimistic limits on the cluster-scale DM SI cross section, which represents an improvement of three to five orders of magnitude over the results using six clusters of galaxies (Δ(σχ/mχ)∼2 × 10−2 cm2 g−1) (Kaplinghat et al. 2016). The results are shown in Fig. 3. We now briefly describe the effectiveness of our method in the context of SIDM particle physics. To elaborate this idea, we take the simplest SIDM model, which could be a real scalar field s with quartic SIs (λss4/4!) (de Martino et al. 2020). Although there are several ways to build this type of models, the self-coupling strength in the dark sector is characterized by λs, which should be in the range of ( ) due to the stability of the potential and perturbation limits (Cheng & Bian 2019). Figure 4 shows the preferred region of the mass of the DM particle ms and the self-coupling strength λs on the scales of galaxies and galaxy clusters, based on the simulated data regarding strongly lensed GW signals from the ET. Our final results demonstrate that in the framework of SIDM capable of solving the small-scale issues of the CDM paradigm, the DM particle mass (within some specific SIDM models) can be assessed with an accuracy of ∼O(0.1) GeV. This conclusion, which could be extended to space-based detectors (DECIGO) and other SIDM models (e.g., fermionic DM particles that self-interact via a light mediator) (Tulin et al. 2013a,b), will strengthen the constraining power of our method to inspire new observational programs and theoretical work in the future.
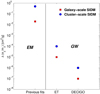 |
Fig. 3. Limits on the DM scattering cross-section per unit mass (σχ/mχ) on the scales of galaxy and galaxy clusters, based on the current and future observations in the EM and GW domain. |
4. Summary and outlook
The impact of the results presented in this work is expected to increase significantly as more strongly lensed GWs are observed. However, based on our results and arguments, the final question still is whether it is technically possible to achieve uncertainties this small for the measurements of DM self-scattering. Many technical problems would be involved from the observational point of view. For instance, the current low detection rate of inspiraling double compact object detection and lensing rate may be due to the lack of either the necessary high temporal resolution or a wide enough field of view in the current EM and GW detectors. Fortunately, the upcoming and planned GW detectors (e.g. ET and DECIGO) and wide-area and deep surveys (e.g. the LSST), with a much wider field of view and higher sensitivity, will be able to discover and precisely localize a large number of strongly lensed GW and EM events. However, it is very likely that only some fraction of the GWs with EM counterparts will be measured. This means that we would observe some lensed GW signals from NS-NS systems without an electromagnetic counterpart. Moreover, accurate lens reconstruction could also be difficult when the Einstein radius of the lens is too small or the background galaxy is too dim for a redshift measurement. Therefore, we need to be cautious about the number of strongly lensed GW signals that allow both the determination of EM counterparts and precise lens reconstruction. Secondly, the systematic floor needs to be further studied for future works in order to let us know how powerful this lensing method might be in probing the distribution of DM exhibiting elastic and velocity-independent SIs. For instance, we still need precise measurements of the image magnification (or the amplification factor of GW signals), which calls for more knowledge about the AGN accretion models and local image environments from astrophysics inputs. Finally, if the estimates of the mean collision velocity for DM particles have large uncertainties, the results shown in Fig. 3–4 might be affected. Accounting for the uncertainty of the mean collision velocity on the scales of galaxy and cluster, Eq. (6) might make these limits less stringent. To summarize, with more abundant observational information in the future, we will have a better understanding of the SI nature of DM at both galaxy and cluster scales, and we will also know better how to use this as a probe of the large-scale distribution of DM in the GW domain, as discussed in this Letter.
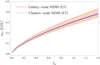 |
Fig. 4. Limits on the mass of DM particles and the coupling constant reflecting the strength of SIs on the scales of galaxies and galaxy clusters, based on lensed GW signals in ET. The dotted lines denotes the central value, and the 68.3% C.L. is shown by the red (blue) shaded region. |
Acknowledgments
This work was supported by the National Natural Science Foundation of China under Grants Nos. 12021003, 11690023, and 11920101003; the National Key R&D Program of China No. 2017YFA0402600; the Strategic Priority Research Program of the Chinese Academy of Sciences, Grant No. XDB23000000; the Interdiscipline Research Funds of Beijing Normal University; the China Manned Space Project (Nos. CMS-CSST-2021-B01 and CMS-CSST-2021-A01); and the CAS Project for Young Scientists in Basic Research under Grant No. YSBR-006. M.B. was supported by Foreign Talent Introducing Project and Special Fund Support of Foreign Knowledge Introducing Project in China (No. G2021111001L).
References
- Abbott, B. P., et al. (LIGO Scientific Collaboration and Virgo Collaboration) 2016, PRL, 116, 061102 [CrossRef] [PubMed] [Google Scholar]
- Abbott, B. P., et al. (LIGO Scientific Collaboration and Virgo Collaboration) 2017, PRL, 119, 161101 [NASA ADS] [CrossRef] [Google Scholar]
- Aghanim, N., Akrami, Y., Ashdown, M., et al. 2020, A&A, 641, A6 [NASA ADS] [CrossRef] [EDP Sciences] [Google Scholar]
- Atreya, A., Bhatt, J. R., & Mishra, A. 2018, JCAP, 02, 024 [Google Scholar]
- Auger, M. W., Treu, T., Bolton, A. S., et al. 2010, ApJ, 724, 511 [NASA ADS] [CrossRef] [Google Scholar]
- Belgacem, E., Dirian, Y., Foffa, D., & Maggiore, M. 2018a, PRD, 97, 104066 [NASA ADS] [CrossRef] [Google Scholar]
- Belgacem, E., Dirian, Y., Foffa, D., & Maggiore, M. 2018b, PRD, 98, 023510 [NASA ADS] [CrossRef] [Google Scholar]
- Bonvin, V., Chan, J. H. H., Millon, M., et al. 2018, A&A, 616, A183 [NASA ADS] [CrossRef] [EDP Sciences] [Google Scholar]
- Cai, R.-G., & Yang, T. 2017, PRD, 95, 044024 [NASA ADS] [CrossRef] [Google Scholar]
- Cai, R.-G., Guo, Z.-K., Yang, T., et al. 2016, PRD, 93, 043517 [NASA ADS] [CrossRef] [Google Scholar]
- Cao, S., Zhu, Z.-H., & Liang, N. 2011, A&A, 529, A61 [NASA ADS] [CrossRef] [EDP Sciences] [Google Scholar]
- Cao, S., Biesiada, M., Zheng, X. G., et al. 2015, ApJ, 806, 185 [NASA ADS] [CrossRef] [Google Scholar]
- Cao, S., Biesiada, M., Zheng, X., & Zhu, Z.-H. 2016, MNRAS, 457, 281 [NASA ADS] [CrossRef] [Google Scholar]
- Cao, S., Qi, J.-Z., Cao, Z.-J., et al. 2019, NatSR, 9, 11608 [NASA ADS] [Google Scholar]
- Cao, S., Qi, J., Biesiada, M., et al. 2021, MNRAS, 502, L16 [NASA ADS] [CrossRef] [Google Scholar]
- Cao, S., Liu, T., Biesiada, M., et al. 2022, ApJ, 926, 214 [NASA ADS] [CrossRef] [Google Scholar]
- Chen, G. C.-F., Fassnacht, C. D., Suyu, S. H., et al. 2018, MNRAS, 481, 1115 [NASA ADS] [CrossRef] [Google Scholar]
- Cheng, W., & Bian, L. 2019, PRD, 99, 035038 [NASA ADS] [CrossRef] [Google Scholar]
- Choi, Y.-Y., Park, C., & Vogeley, M. S. 2007, ApJ, 658, 884 [NASA ADS] [CrossRef] [Google Scholar]
- Collett, T. E. 2015, ApJ, 811, 20 [NASA ADS] [CrossRef] [Google Scholar]
- Collett, T. E., & Bacon, D. 2017, PRL, 118, 091101 [NASA ADS] [CrossRef] [Google Scholar]
- Collett, T. E., & Cunnington, S. D. 2016, MNRAS, 462, 3255 [NASA ADS] [CrossRef] [Google Scholar]
- Cutler, C., & Holz, D. E. 2009, PRD, 80, 104009 [NASA ADS] [CrossRef] [Google Scholar]
- de Martino, I., Chakrabarty, S. S., Cesare, V., et al. 2020, Universe, 6, 107 [NASA ADS] [CrossRef] [Google Scholar]
- Dexter, J., & Agol, E. 2011, ApJ, 727, L24 [Google Scholar]
- Ding, X., Biesiada, M., & Zhu, Z.-H. 2015, JCAP, 12, 006 [CrossRef] [Google Scholar]
- Dooley, G. A., Peter, A. H. G., Vogelsberger, M., et al. 2016, MNRAS, 461, 710 [NASA ADS] [CrossRef] [Google Scholar]
- Ehlers, J., & Prasanna, A. R. 1996, CQG, 13, 2231 [NASA ADS] [CrossRef] [Google Scholar]
- Etherington, I. M. H. 1993, Philos. Mag., 15, 761 (reprinted in 2007, Gen. Rel. Grav. 39, 1055) [Google Scholar]
- Foxley-Marrable, M., Collett, T. E., Vernardos, G., et al. 2018, MNRAS, 478, 5081 [NASA ADS] [CrossRef] [Google Scholar]
- Geng, S., Cao, S., Liu, T., et al. 2020, ApJ, 905, 54 [NASA ADS] [CrossRef] [Google Scholar]
- Goobar, A., Amanullah, R., Kulkarni, S. R., et al. 2017, Science, 356, 291 [Google Scholar]
- Goswami, G., Chakravarty, G. K., Mohanty, S., & Prasanna, A. R. 2017, PRD, 95, 103509 [NASA ADS] [CrossRef] [Google Scholar]
- Hawking, S. W. 1966, ApJ, 145, 544 [NASA ADS] [CrossRef] [Google Scholar]
- Hayashi, K., Masahiro, I., Shin, K., et al. 2021, PRD, 103, 023017 [NASA ADS] [CrossRef] [Google Scholar]
- Hlozek, R. A., Collett, T., Galbany, L., et al. 2019, BAAS, 51, 369 [NASA ADS] [Google Scholar]
- Kaplinghat, M., Sean, T., Yu, H. B., et al. 2016, PRL, 116, 041302 [NASA ADS] [CrossRef] [Google Scholar]
- Kawamura, S., Nakamura, T., Ando, M., et al. 2006, CQG, 23, 125 [Google Scholar]
- Koopmans, L. V. E. 2005, in Proceedings of XXIst IAP Colloquium, "Mass Profiles& Shapes of Cosmological Structures" (Paris, 4–9 July 2005), eds. G. A. Mamon, F. Combes, C. Deffayet, & B. Fort (Paris: EDP Sciences) [Google Scholar]
- Kuzio, R., McGaugh, S. S., de Blok, W. J. G., et al. 2008, ApJ, 676, 920 [CrossRef] [Google Scholar]
- Li, T. G. 2015, Extracting Physics from Gravitational Waves: Testing the Strong-field Dynamics of General Relativity and Inferring the Large-scale Structure of the Universe (Springer) [Google Scholar]
- Li, S. S., Mao, S., & Lu, Y. 2018, MNRAS, 476, 2220 [NASA ADS] [CrossRef] [Google Scholar]
- Liao, K. 2019, ApJ, 871, 113 [NASA ADS] [CrossRef] [Google Scholar]
- Liao, K., Fan, X. L., Ding, X., et al. 2017, Nat. Commun., 8, 1148 [NASA ADS] [CrossRef] [Google Scholar]
- Lu, B. Q., Huang, D., & Wu, Y. L. 2018, ArXiv e-prints [arXiv:1803.11397] [Google Scholar]
- Markevitch, M., Gonzalez, A. H., Clowe, D., et al. 2004, ApJ, 606, 819 [NASA ADS] [CrossRef] [Google Scholar]
- Mastrogiovanni, S., Steer, D., & Barsuglia, M. 2020, PRD, 102, 044009 [NASA ADS] [CrossRef] [Google Scholar]
- Nissanke, S., Kasliwal, M., & Georgieva, A. 2010, ApJ, 725, 496 [NASA ADS] [CrossRef] [Google Scholar]
- Oguri, M. 2010, PASJ, 62, 1017 [NASA ADS] [Google Scholar]
- Oguri, M., & Marshall, P. J. 2010, MNRAS, 405, 2579 [NASA ADS] [Google Scholar]
- Oh, S.-H., de Blok, W. J. G., Brinks, E., et al. 2011, ApJ, 141, 193 [CrossRef] [Google Scholar]
- Pan, Y., He, Y., Qi, J., et al. 2021, ApJ, 911, 135 [NASA ADS] [CrossRef] [Google Scholar]
- Piórkowska, A., Shaoqi, H., Marek, B., et al. 2021, ApJ, 908, 196 [CrossRef] [Google Scholar]
- Qi, J. Z., Cao, S., Zheng, C., et al. 2019, PRD, 99, 063507 [NASA ADS] [CrossRef] [Google Scholar]
- Read, J., Iorio, G., Agertz, O., et al. 2017, MNRAS, 467, 2019 [NASA ADS] [Google Scholar]
- Ruff, A., Gavazzi, R., Marshall, P. J., et al. 2011, ApJ, 727, 96 [NASA ADS] [CrossRef] [Google Scholar]
- Schaye, J., Crain, R. A., Bower, R. G., et al. 2015, MNRAS, 446, 521 [Google Scholar]
- Seljak, U. 1994, ApJ, 436, 509 [NASA ADS] [CrossRef] [Google Scholar]
- Sonnenfeld, A., Treu, T., Gavazzi, R., et al. 2012, ApJ, 752, 163 [Google Scholar]
- Sonnenfeld, A., Gavazzi, R., Suyu, S. H., Treu, T., & Marshall, P. J. 2013, ApJ, 777, 97 [Google Scholar]
- Springel, V., Pakmor, R., Pillepich, A., et al. 2018, MNRAS, 475, 676 [Google Scholar]
- Suyu, S. H., Marshall, P. J., Auger, M. W., et al. 2010, ApJ, 711, 201 [Google Scholar]
- Suyu, S. H., Hensel, S. W., McKean, J. P., et al. 2012, ApJ, 750, 10 [Google Scholar]
- Suyu, S. H., Bonvin, V., Courbin, F., et al. 2017, MNRAS, 468, 2590 [Google Scholar]
- The LIGO Scientific Collaboration, the Virgo Collaboration& the KAGRA Collaboration 2021, ArXiv e-prints [arXiv:2111.03606]. [Google Scholar]
- Tulin, S., & Yu, H. B. 2018, Phys. Rep., 730, 1 [NASA ADS] [CrossRef] [Google Scholar]
- Tulin, S., Yu, H.-B., & Zurek, K. M. 2013a, PRD, 87, 115007 [NASA ADS] [CrossRef] [Google Scholar]
- Tulin, S., Yu, H.-B., & Zurek, K. M. 2013b, PRL, 110, 111301 [NASA ADS] [CrossRef] [Google Scholar]
- Yahalomi, D., Schechter, P. L., Wambsganss, J., et al. 2017, ArXiv e-prints [arXiv:1711.07919] [Google Scholar]
- Zhao, W., Van Den Broeck, C., Baskaran, D., et al. 2011, PRD, 83, 023005 [NASA ADS] [CrossRef] [Google Scholar]
- Zheng, X., Cao, S., Liu, Y., et al. 2021, EPJC, 81, 14 [NASA ADS] [CrossRef] [EDP Sciences] [Google Scholar]
- Zimdahl, W., Schwarz, D. J., Balakin, A. B., et al. 2001, PRD, 64, 3501 [Google Scholar]
Appendix A: Error strategy in the simulations of strongly lensed gravitational waves
We summarize the uncertainties of multiple measurements in strongly lensed NS-NS systems, that is, the precision of lens reconstruction, the precision of time delays, and the precision of lensed standard sirens. The error strategy below is used to produce the measurements of β(zl, zs) expected to be derived by future GW detectors (see Fig. 1 for details).
A.1. Precision of lens reconstruction
Three sources of uncertainty are included in our simulation of lens reconstruction. With the observation of host arcs by deep imaging of the HST, the Einstein radius of multiple images and the lens mass slope can be measured precisely and accurately (at the level of 1% ) based on advanced lens modelling techniques (Suyu et al. 2010, 2012) and kinematic modelling methods (Auger et al. 2010; Sonnenfeld et al. 2012). This error strategy has been extensively used in the simulation of the LSST lens sample, with high-quality (sub-arcsecond) imaging data in general (Collett & Cunnington 2016). Although the joint lensing and stellar-dynamical analysis could generate 5% accuracy on the total mass-density slope (Ruff et al. 2011), the lessons learnen from lensed quasar results showed that this accuracy is expected to increase to 1%, with supplementary information about time delays obtained by the COSMOGRAIL (Bonvin et al. 2018) or H0LiCOW collaboration (Suyu et al. 2017). Meanwhile, we take 5% as the fractional uncertainty of the observed velocity dispersion, with detailed follow-up spectroscopic information from other ground-based facilities, that is, multi-object and single-object spectroscopy to enhance dark energy science from LSST (Hlozek et al. 2019).
A.2. Precision of time delays
We consider three sources of uncertainty in the simulation of time-delay measurements. It is well recognized that coalescing NS-NS systems manifested as short gamma-ray bursts can have many advantages as precise lensing time-delay indicators. However, lensed GW signals could provide extremely accurate Δt measurements, with a detailed analysis of the waveform from the GW detection pipeline (Liao et al. 2017) (accuracy ranging from 10−4 ms to 0.1 s). Therefore, the fractional uncertainty of Δt could be neglected. On the other hand, the detection of the EM counterpart would be very beneficial. The host galaxy image followed up with a quality typical to HST observations with dedicated lens modelling techniques would result in a precision of 0.5% in lens modelling; specifically, the Fermat potential difference reconstruction for a well-measured lensed GW system (Liao et al. 2017). The analogous uncertainty is 3% for almost all quasar-galaxy systems, with lensed quasar images quality typical to HST observations (Suyu et al. 2017). In this analysis, we applied a strategy to calculate the uncertainty of Δϕ, from the measurements of the lens mass profile, the Einstein radius, and their corresponding uncertainties (Cao et al. 2019). Finally, the effect of the light-of-sight density fluctuation on the gravitational time delays should be taken into account. For each lens system, we added an additional 1% relative uncertainty to the lens modelling, which naturally appears due to mass along the line of sight to the source (Seljak 1994). This additional line-of-sight systematic uncertainty (at the 1% level) is also characteristic for that derived in typical strongly lensed quasar systems (Suyu et al. 2017).
A.3. Precision of lensed standard sirens
We account for two sources of uncertainties in the simulation of lensed GWs: effective luminosity distance, and lensing magnification. Firstly, to obtain the uncertainty of DL, eff(z) from the GW signal of NS-NS standard sirens observed by different detectors, the distance precision was taken as  , with the instrumental measurement uncertainty
  , where ρnet denotes the combined signal-to-noise ratio (S/N) for the network of independent interferometers, that is, the square root of the inner product of the strain in Fourier space (Cai et al. 2016). A detailed description of the noise power spectral density (PSD), which characterizes the sensitivity of the detector, could be found in Cai et al. (2016) and Kawamura et al. (2006). Note that we assumed an ideal situation by setting the inclination angle of the binary orbital angular momentum ι = 0. However, Nissanke et al. (2010) demonstrated the strong correlation between the luminosity distance and the inclination angle of the binary (ι = [0, 180° ]). This distance-inclination degeneracy, which decreases the sensitivity to both parameters, might be broken by the strongly beamed observations (ι < 20°) of short gamma-ray bursts as the electromagnetic counterparts of GWs (Li 2015). Therefore, considering the maximum effect of the inclination on the combined S/N, we chose to double the instrumental uncertainty of DL as the upper limit, as was proposed in the recent study of the third-generation GW detector (ET) based on a Fisher information matrix (Cai & Yang 2017). This strategy has been extensively applied in subsequent works focusing on the constraint ability of standard siren GWs on different cosmological parameters (Geng et al. 2020; Pan et al. 2021; Zheng et al. 2021; Cao et al. 2022). Moreover, the measurements of luminosity distance are also affected by the weak-lensing effect, which is modeled as
  for ET (Zhao et al. 2011) and
  for DECIGO (Cutler & Holz 2009). Secondly, the amplification factor of the GW signal along with the corresponding uncertainty is related to the magnification (μ) and its uncertainty of the EM counterpart, following the recent discussion of gravitational lensing statistics and the magnification by galaxies (Suyu et al. 2010, 2012). More specifically, the uncertainty of μ is calculated from the observables and their uncertainties (i.e. the Einstein radius and the mass profile slope) (Cao et al. 2019) by solving the lens equation with glafic in the framework of a specific lens model (Oguri 2010; Oguri & Marshall 2010). In our simulated data, the image magnification is expected to be determined at a level of ∼10%. Meanwhile, recent works have studied the microlensing (ML) effect generated by stars in lensing galaxies, which potentially biases the magnification map of strongly lensed sources (Foxley-Marrable et al. 2018). Although the community is mainly of the opinion that this effect needs to be incorporated in a strong-lensing analysis, much uncertain input for the ML priors on the AGN accretion disk models remains (Dexter & Agol 2011), as well as on the local environments for images and mass function for the stars (Chen et al. 2018). Therefore, to assess the impact of ML on luminosity distance estimates, we assumed an additional systematic 5% uncertainty on the magnification measurements for all lensed gravitational waves. A similar error strategy can be found in the recent discussion of Liao (2019), focusing on ML time delays from the light curves of strongly lensed quasars. We emphasize that for galactic-scale lenses with point-like background sources, the model predictions in the generic case for image magnifications could be very large (Yahalomi et al. 2017). However, for strongly lensed standard sirens in the GW domain, the lensing magnification could be more precisely measured in a lens-model-independent way by comparing the observed flux with that of other unlensed GWs within a narrow redshift bin (Goobar et al. 2017).
All Figures
|
Fig. 1. Individual measurements of the damping rate of gravitational waves based on future observations of strongly lensed NS-NS systems from ET (upper panel) and DECIGO (lower panel). |
| In the text | |
|
Fig. 2. Fits on the damping rate of GWs based on strongly lensed NS-NS systems from ET and DECIGO. |
| In the text | |
|
Fig. 3. Limits on the DM scattering cross-section per unit mass (σχ/mχ) on the scales of galaxy and galaxy clusters, based on the current and future observations in the EM and GW domain. |
| In the text | |
|
Fig. 4. Limits on the mass of DM particles and the coupling constant reflecting the strength of SIs on the scales of galaxies and galaxy clusters, based on lensed GW signals in ET. The dotted lines denotes the central value, and the 68.3% C.L. is shown by the red (blue) shaded region. |
| In the text | |
Current usage metrics show cumulative count of Article Views (full-text article views including HTML views, PDF and ePub downloads, according to the available data) and Abstracts Views on Vision4Press platform.
Data correspond to usage on the plateform after 2015. The current usage metrics is available 48-96 hours after online publication and is updated daily on week days.
Initial download of the metrics may take a while.