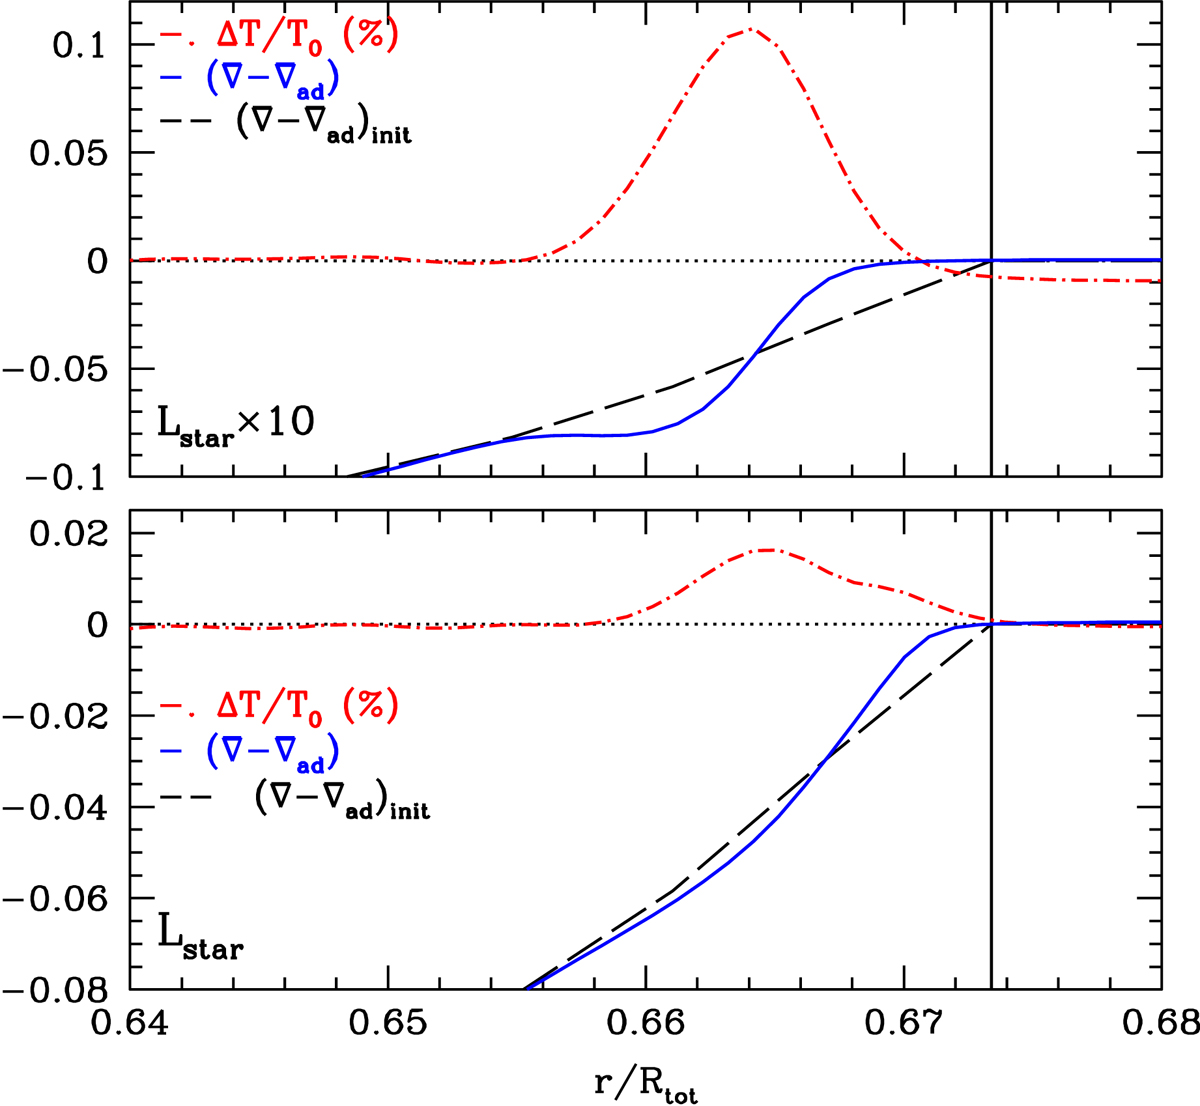
Fig. 1.
Download original image
Radial profile of the temperature departure ΔT/T0 from the initial profile T0 and of the sub-adiabaticity (∇−∇ad) close to the convective boundary predicted by 2D hydrodynamical simulations (B21) of solar-like models. Lower panel: model with a realistic stellar luminosity and upper panel: model with luminosity enhanced by a factor of ten. The dash-dotted red lines show ΔT/T0 (in %), the relative difference between the time and space averages of the temperature, T, and the initial temperature, T0. The solid blue lines show the time and space averages of the sub-adiabaticity (∇−∇ad). The dashed black lines show the initial profile of the sub-adiabaticity, (∇−∇ad)init. The convective boundary is indicated by the vertical solid line (see details in B21).
Current usage metrics show cumulative count of Article Views (full-text article views including HTML views, PDF and ePub downloads, according to the available data) and Abstracts Views on Vision4Press platform.
Data correspond to usage on the plateform after 2015. The current usage metrics is available 48-96 hours after online publication and is updated daily on week days.
Initial download of the metrics may take a while.