Fig. 7.
Download original image
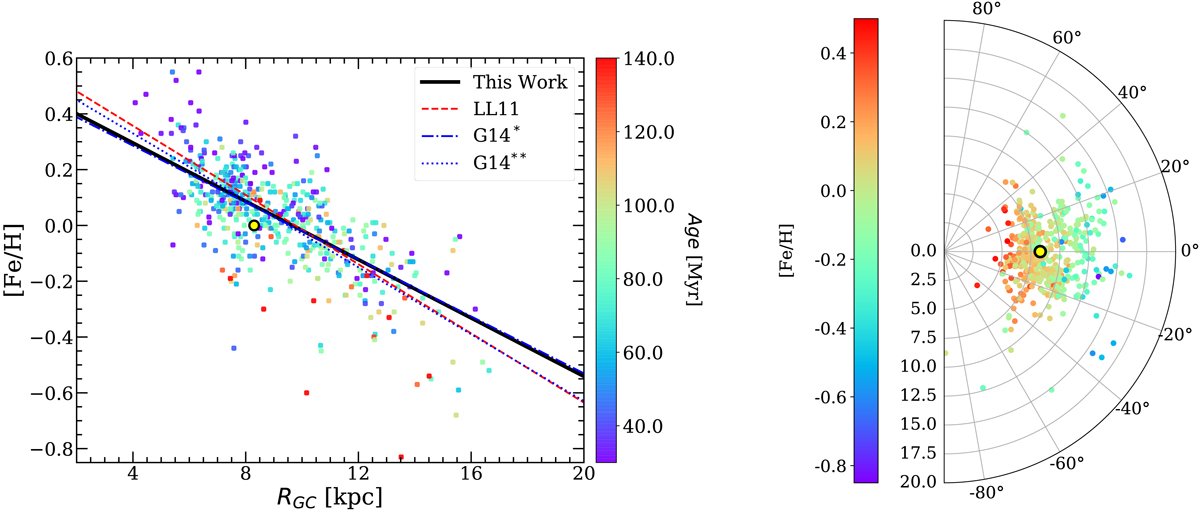
Metallicity gradient in the Galactic disc inferred from the DCEPs analysed in this work. Left panel: filled circles represent the sample of DCEPs adopted in this work which are colour-coded according to their age. The thick black line shows the linear regression to the data obtained in this work (the line is representative of both Eqs. (5) and (6), which are indistinguishable in this diagram). Selected literature results are shown for comparison: LL11=Luck & Lambert (2011); G14* = UVES and FEROS sample from Genovali et al. (2014); G14* = entire sample of Genovali et al. (2014). Right panel: polar representation of the DCEPs considered in this work. Dots are colour-coded according to the DCEPs’ metallicity. In both panels, a yellow and black circle represents the Sun.
Current usage metrics show cumulative count of Article Views (full-text article views including HTML views, PDF and ePub downloads, according to the available data) and Abstracts Views on Vision4Press platform.
Data correspond to usage on the plateform after 2015. The current usage metrics is available 48-96 hours after online publication and is updated daily on week days.
Initial download of the metrics may take a while.