Fig. 5.
Download original image
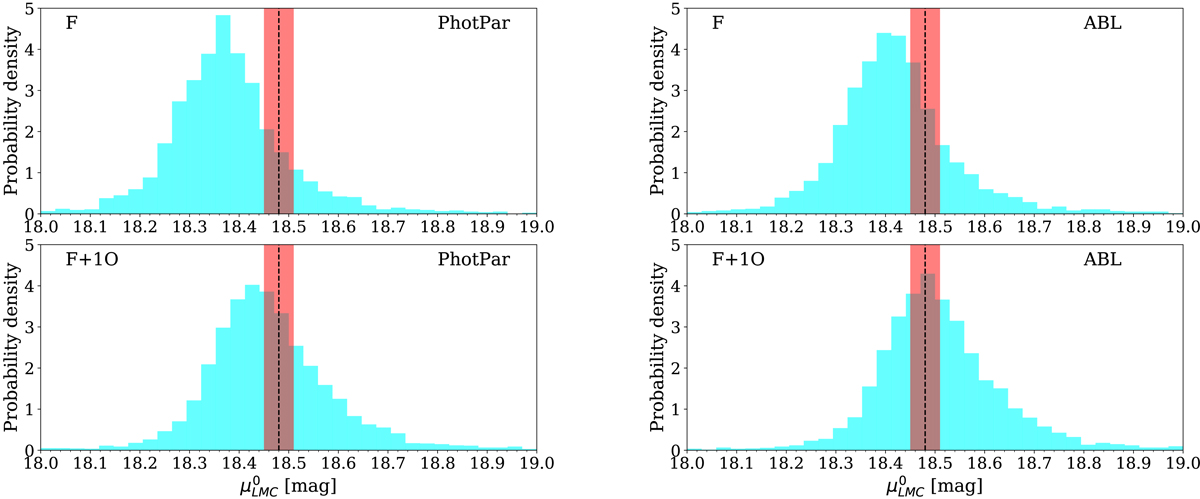
Distribution of the dereddened DM of the LMC calculated by using the PWZ relations listed in Table 2 (light blue histograms). The left panels show the results obtained with the PhotPar method for the F (top) and F+1O (bottom) mode DCEPs, respectively. Right panels: same results, but for the ABL method. The red band displays the uncertainty region around the geometric distance of the LMC by Pietrzyński et al. (2019, dashed line).
Current usage metrics show cumulative count of Article Views (full-text article views including HTML views, PDF and ePub downloads, according to the available data) and Abstracts Views on Vision4Press platform.
Data correspond to usage on the plateform after 2015. The current usage metrics is available 48-96 hours after online publication and is updated daily on week days.
Initial download of the metrics may take a while.