Free Access
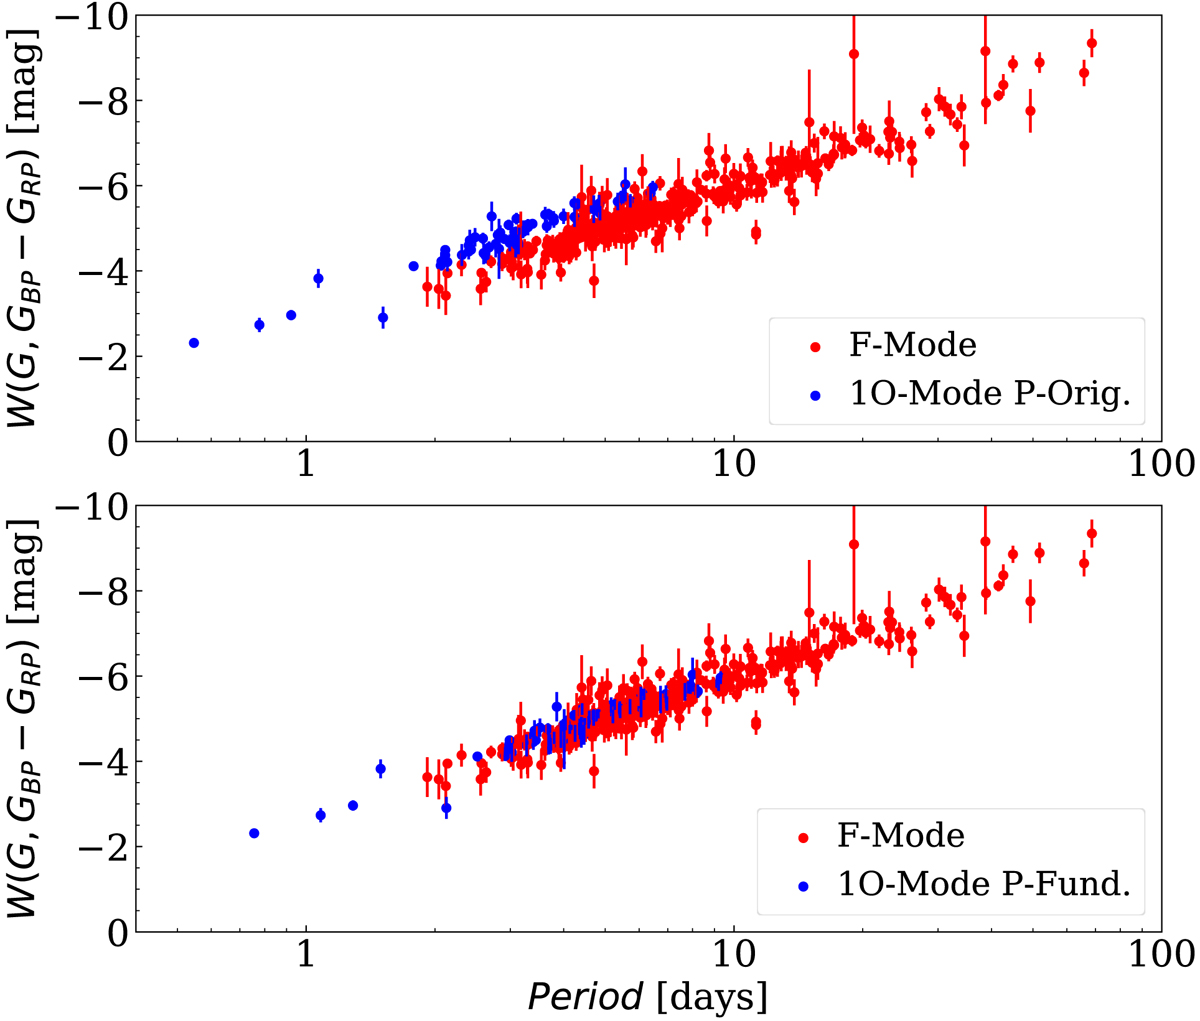
Fig. 3.
Download original image
PW relation in the Gaia bands for the programme stars. Red and blue dots represent F- and 1O-mode pulsators, respectively. Top and bottom panels: PW relation including not fundamentalised and fundamentalised 1O mode DCEPs, respectively.
Current usage metrics show cumulative count of Article Views (full-text article views including HTML views, PDF and ePub downloads, according to the available data) and Abstracts Views on Vision4Press platform.
Data correspond to usage on the plateform after 2015. The current usage metrics is available 48-96 hours after online publication and is updated daily on week days.
Initial download of the metrics may take a while.