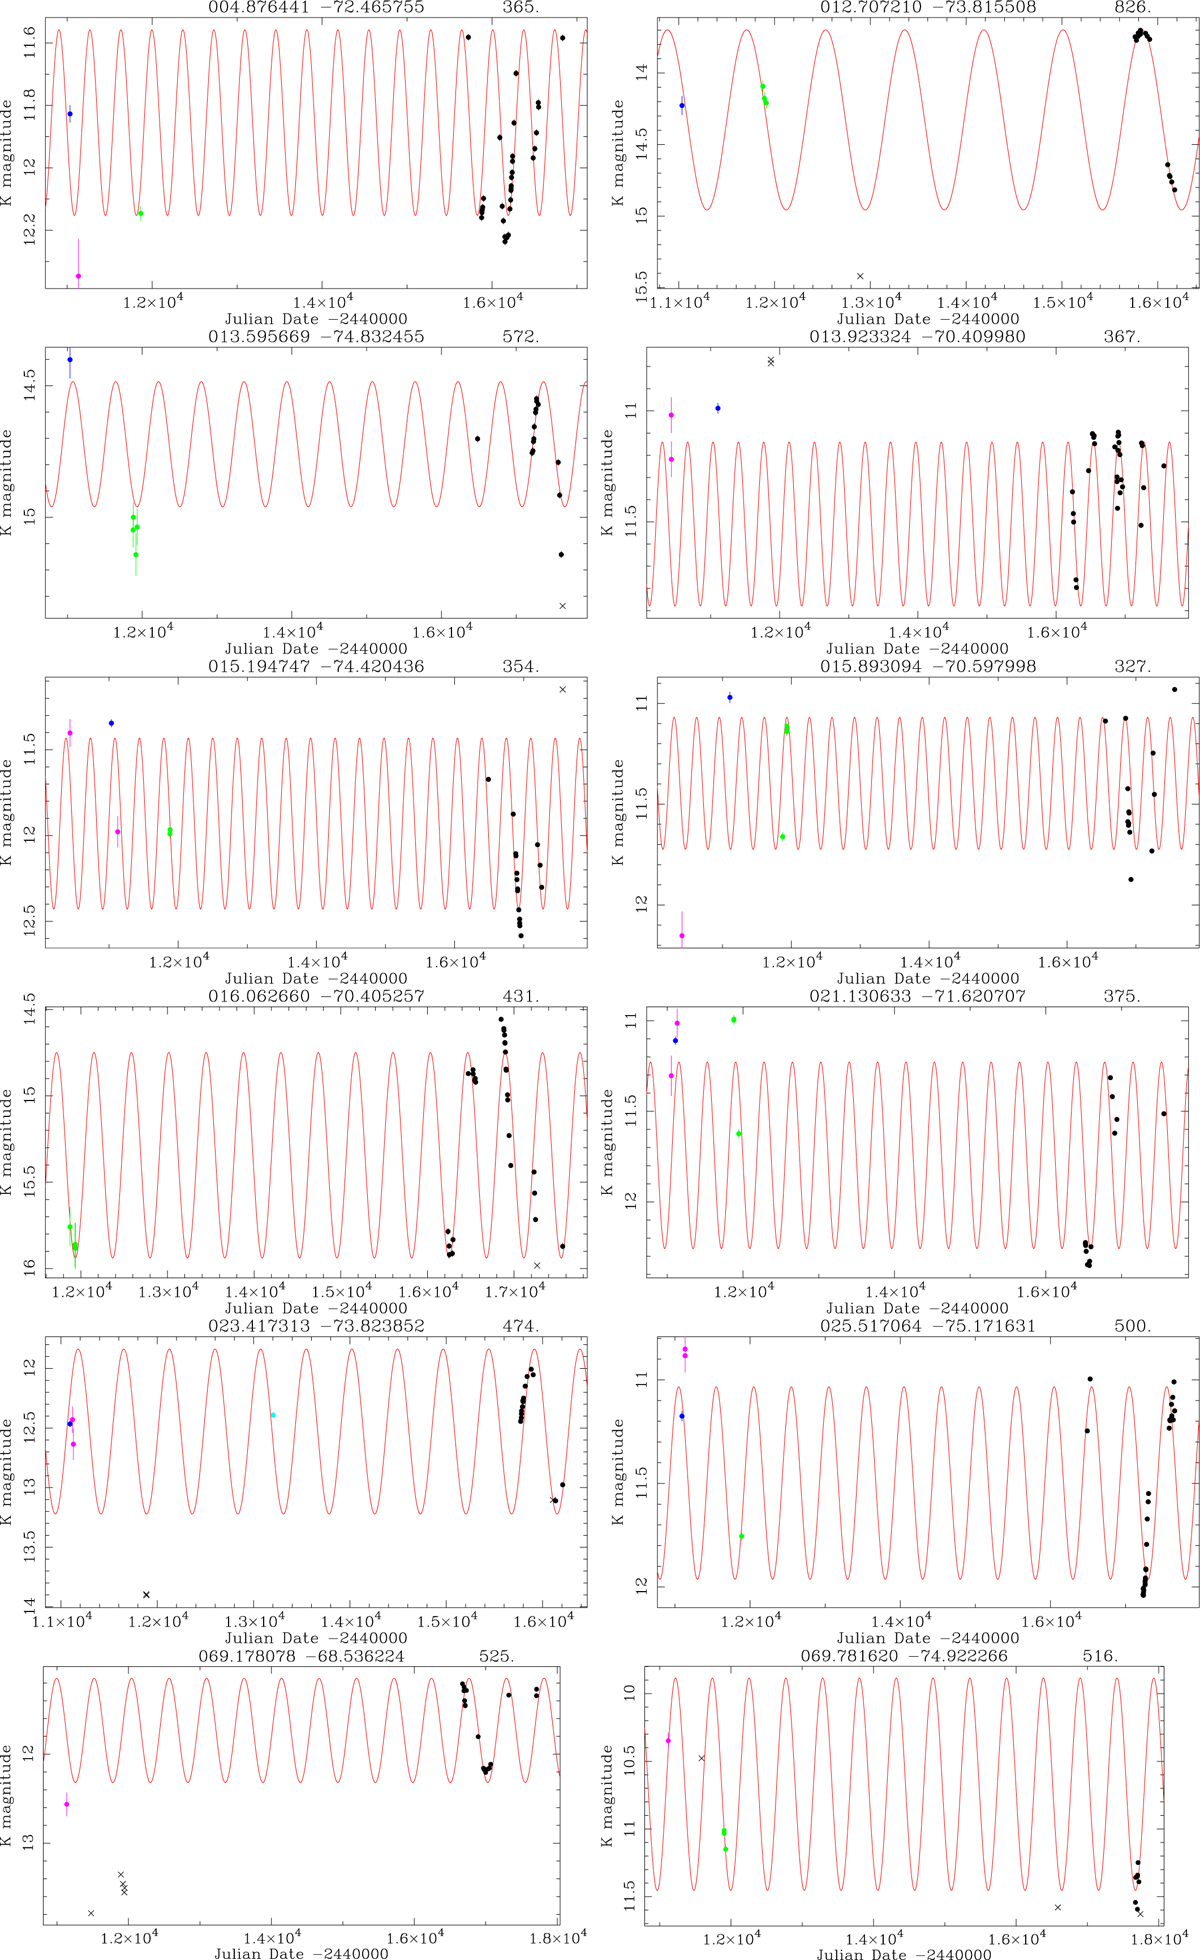
Fig. B.2.
Download original image
Examples of fits to VMC data K-band data. The identifier is listed on the top of each panel, with the period to the right. Data points (with error bars) in black show the VMC, green points represent 2MASS, dark blue points are for 2MASS-6X, light blue points are for the IRSF, and magenta corresponds to DENIS (see Groenewegen et al. 2020).
Current usage metrics show cumulative count of Article Views (full-text article views including HTML views, PDF and ePub downloads, according to the available data) and Abstracts Views on Vision4Press platform.
Data correspond to usage on the plateform after 2015. The current usage metrics is available 48-96 hours after online publication and is updated daily on week days.
Initial download of the metrics may take a while.