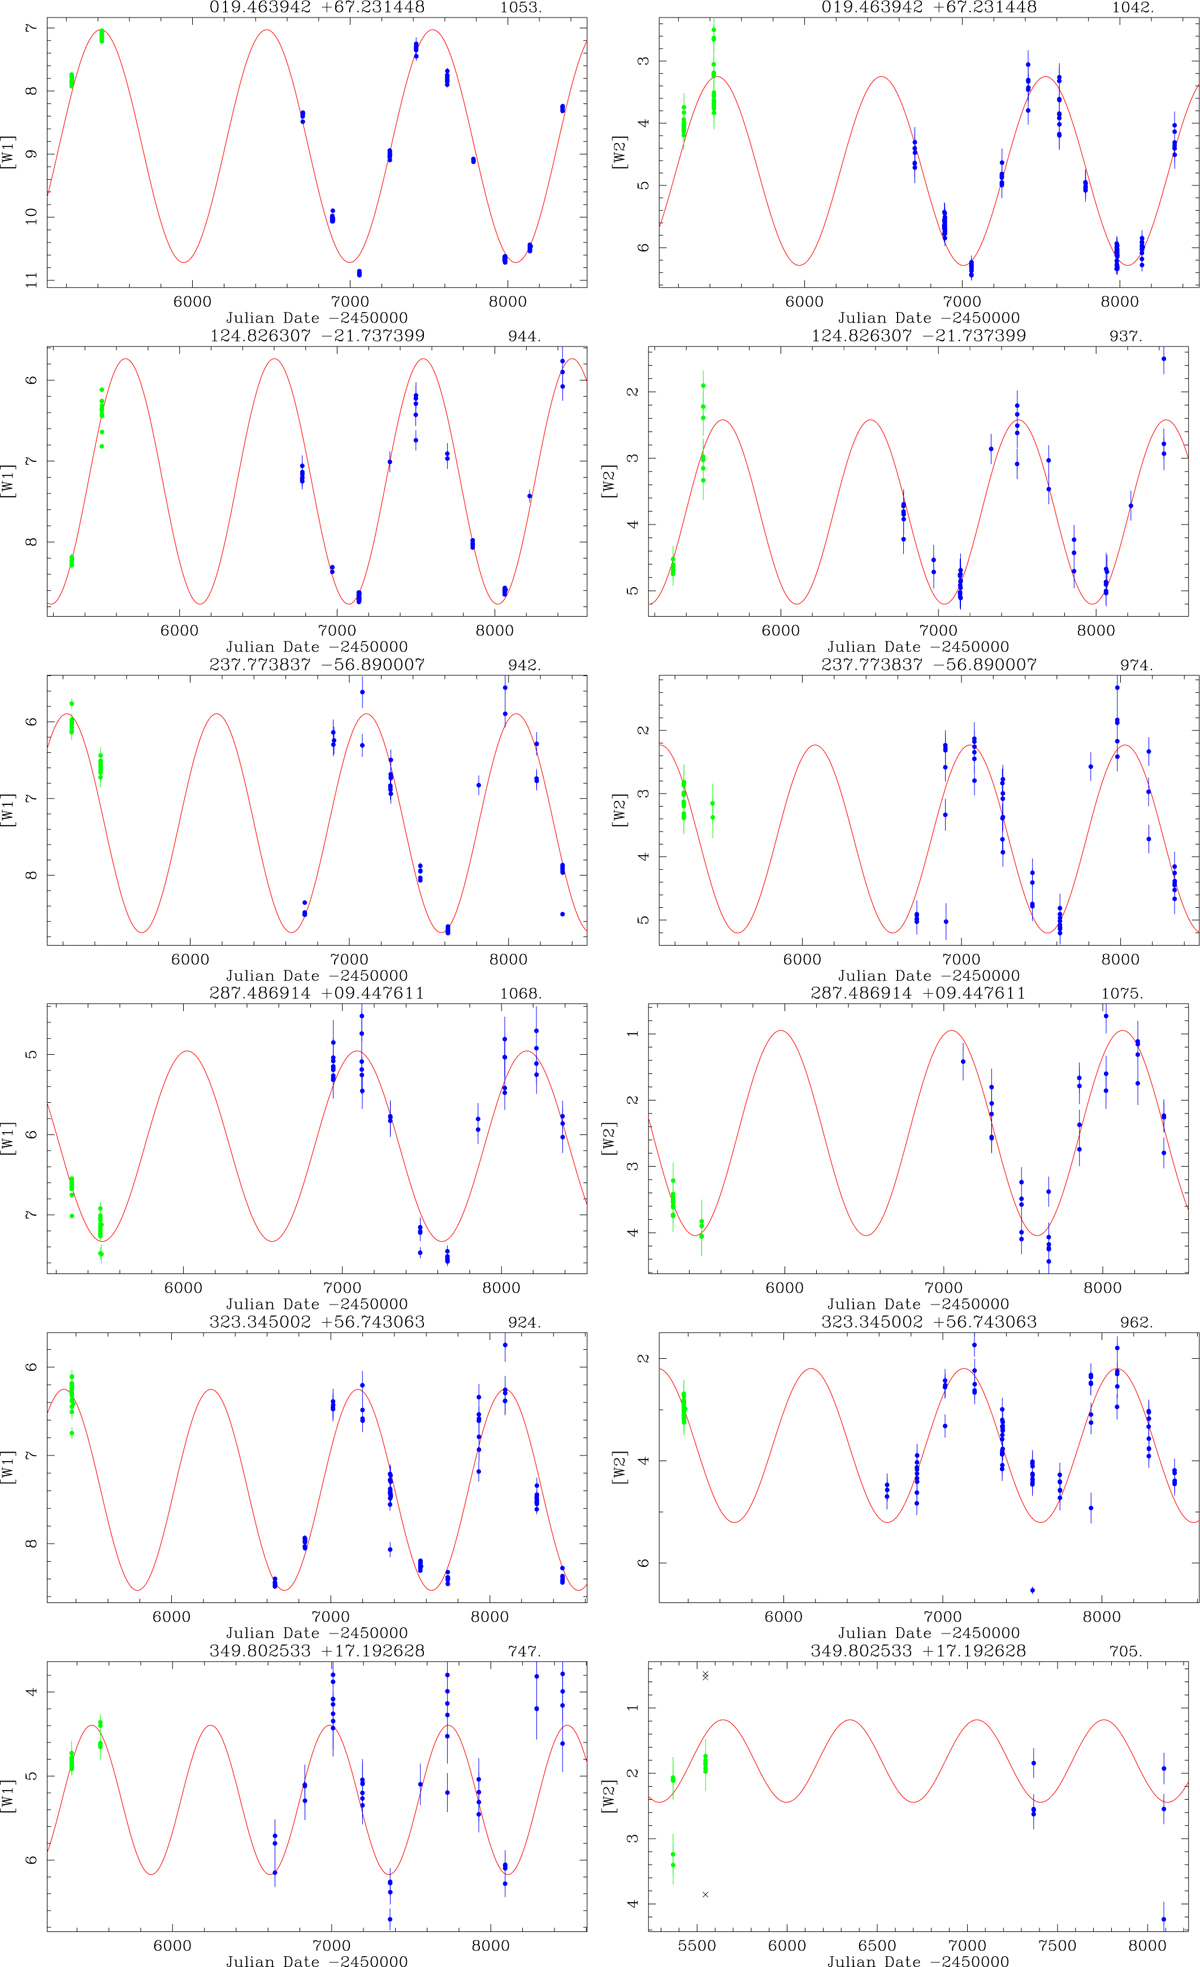
Fig. B.1.
Download original image
Examples of fits to WISE data (W1 on the left, W2 on the right). The identifier is listed on the top of each panel, with the period to the right. Green points refer to WISE, and blue points to NEOWISE data. Crosses indicate points excluded from the fitting. The complete set of LCs is available at https://doi.org/10.5281/zenodo.5825878.
Current usage metrics show cumulative count of Article Views (full-text article views including HTML views, PDF and ePub downloads, according to the available data) and Abstracts Views on Vision4Press platform.
Data correspond to usage on the plateform after 2015. The current usage metrics is available 48-96 hours after online publication and is updated daily on week days.
Initial download of the metrics may take a while.