Free Access
Fig. 6.
Download original image
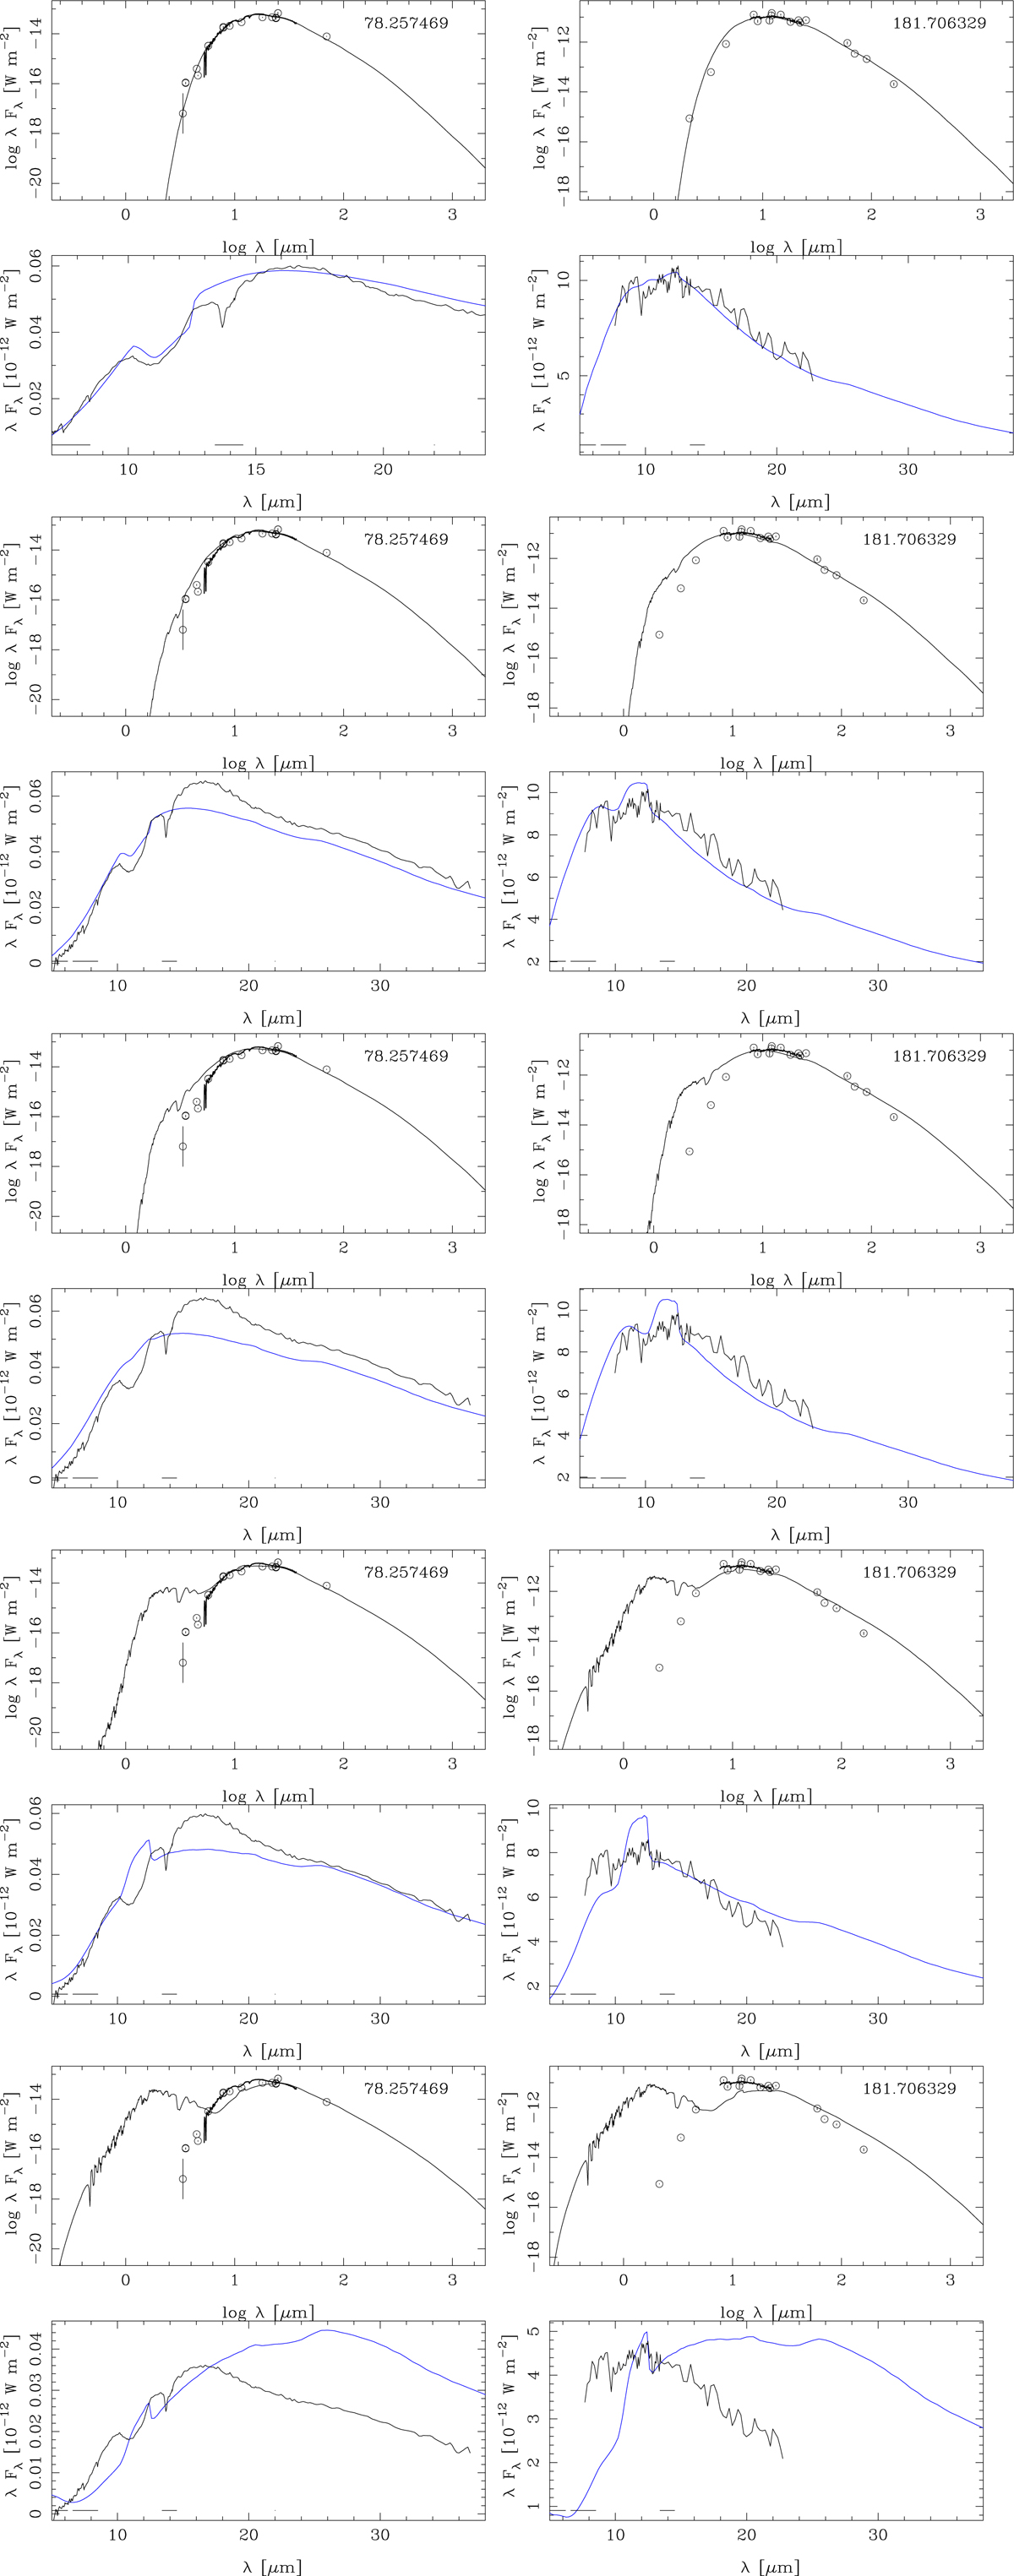
Predicted SEDs and MIR spectra as a function time for two stars (left-hand and right-hand panels) when the MLR stops abruptly and the CSE expands at 10 km s−1. From top to bottom the SED at t = 0, and after 30, 50, 200, and 500 yr.
Current usage metrics show cumulative count of Article Views (full-text article views including HTML views, PDF and ePub downloads, according to the available data) and Abstracts Views on Vision4Press platform.
Data correspond to usage on the plateform after 2015. The current usage metrics is available 48-96 hours after online publication and is updated daily on week days.
Initial download of the metrics may take a while.