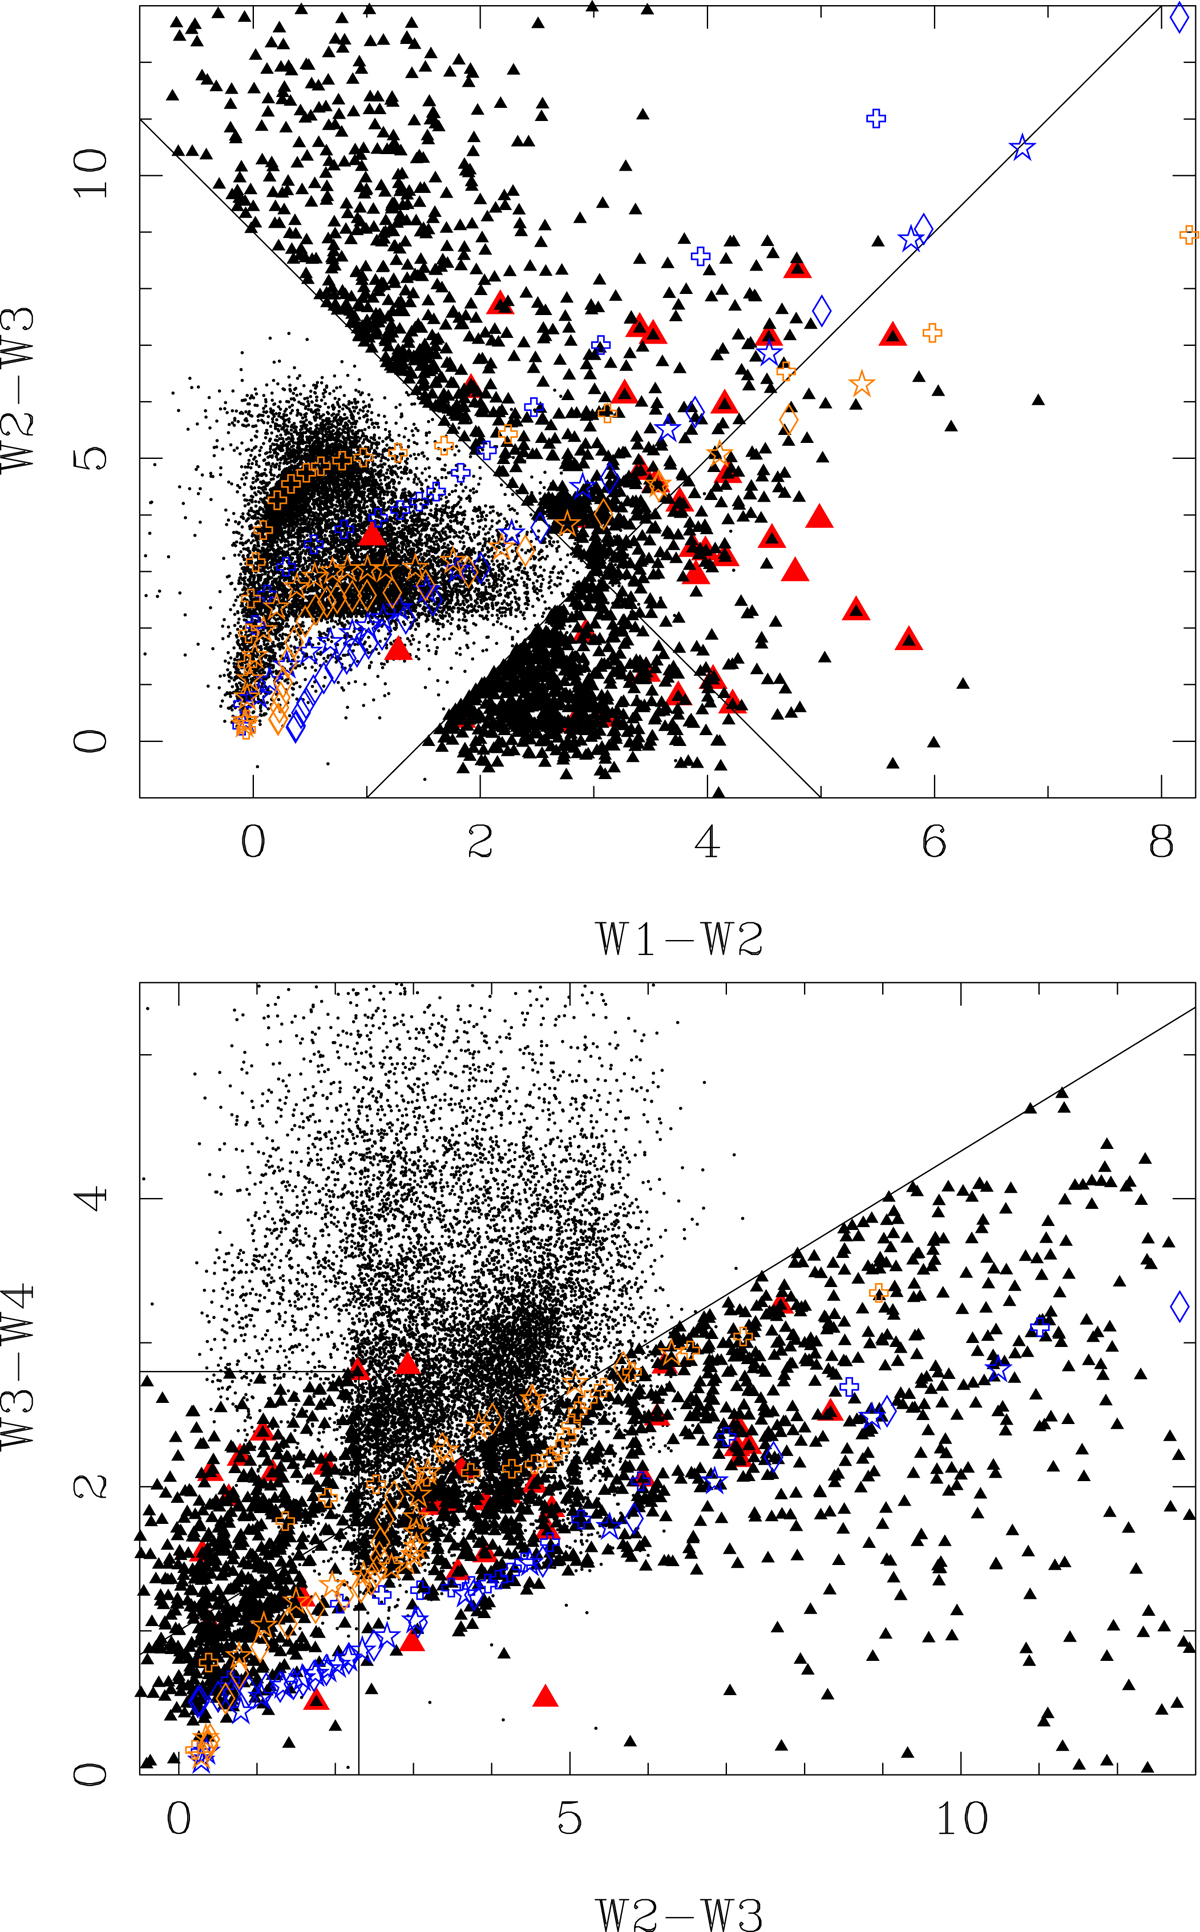
Fig. 1.
Download original image
[W2 − W3]−[W1 − W2] and [W3 − W4]−[W2 − W3] CCDs. Red triangles are the sources from the template sample in Table 1. Small black triangles are selected sources (see main text). Small dots are non-selected sources; to avoid cluttering stricter SN criteria were applied for them to be plotted (see main text). Other symbols indicate sequences of increasing MLRs (see main text). Blue colours represent C-star models while orange colours represent O-star models for (Teff, Tinn) combinations of (2600, 1000), (3300, 800), and (4000, 400 K) in diamonds, five-pointed stars, and open plus signs, respectively.
Current usage metrics show cumulative count of Article Views (full-text article views including HTML views, PDF and ePub downloads, according to the available data) and Abstracts Views on Vision4Press platform.
Data correspond to usage on the plateform after 2015. The current usage metrics is available 48-96 hours after online publication and is updated daily on week days.
Initial download of the metrics may take a while.