Fig. 6.
Download original image
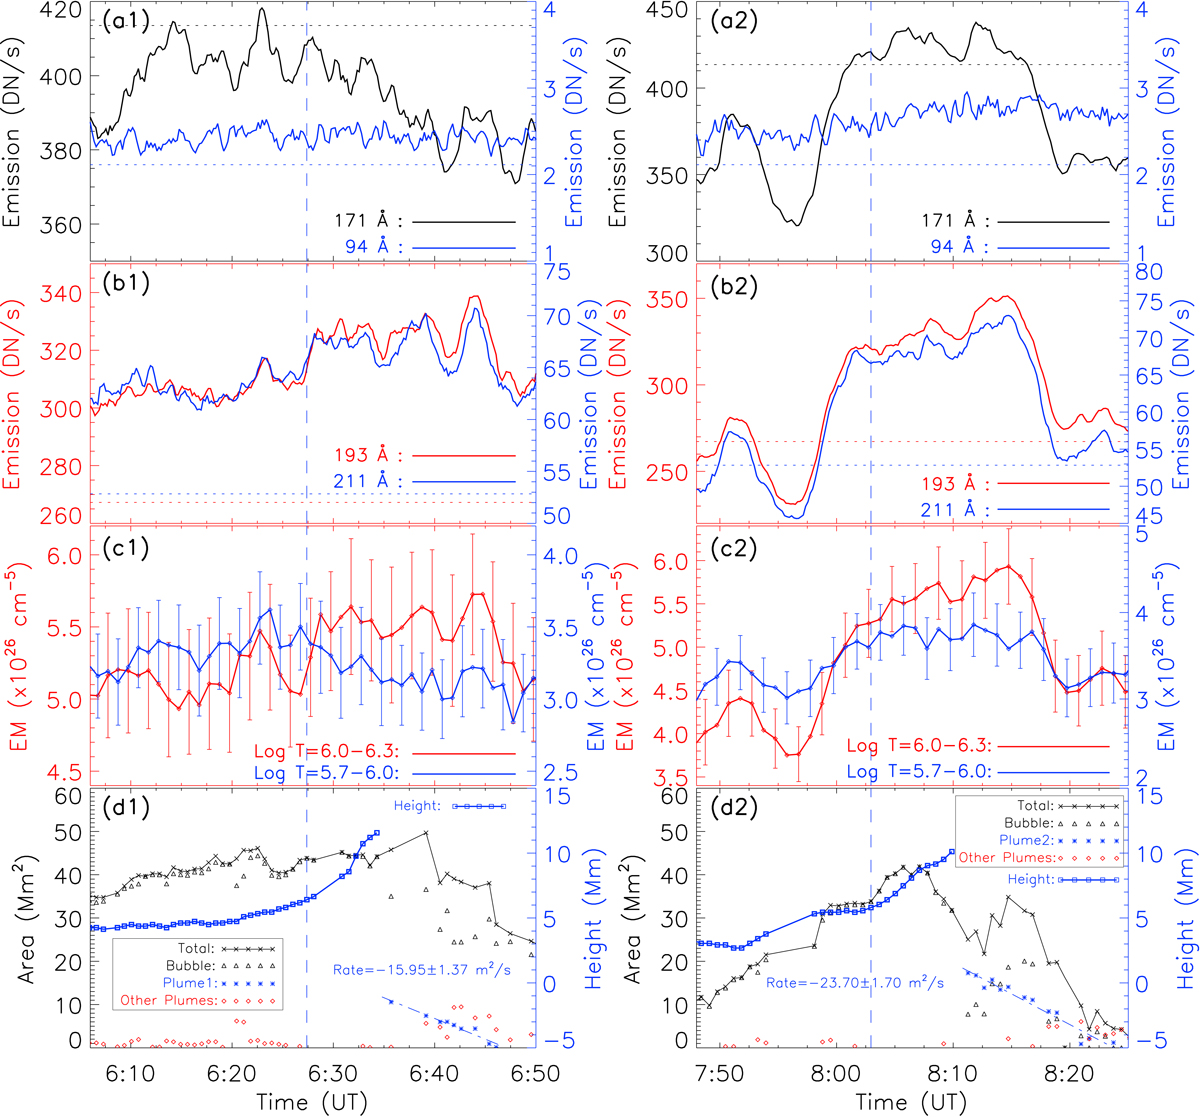
Evolution of different parameters in the bubble and plumes. a1,b1 and c1,d1: variations of different SDO/AIA normalized intensities by exposure duration, EM in the red box of Fig. 5a1, projected areas, and the height for the first large plume. a2,b2 and c2,d2: variations of different SDO/AIA normalized intensities by exposure duration, EM in the red box of Fig. 5b1, projected areas, and the height for the second large plume. The blue vertical dashed line denotes the onset of instability in the bubble top for each large plume. The horizontal dotted lines in panels a1,b1 and a2,b2 denote the corresponding average normalized intensity of background at different wavelengths. The uncertainties in panels c1,c2 are derived directly from the errors of Figs. 5c1,d1 estimated by the Monte-Carlo experiment.
Current usage metrics show cumulative count of Article Views (full-text article views including HTML views, PDF and ePub downloads, according to the available data) and Abstracts Views on Vision4Press platform.
Data correspond to usage on the plateform after 2015. The current usage metrics is available 48-96 hours after online publication and is updated daily on week days.
Initial download of the metrics may take a while.