Fig. 5.
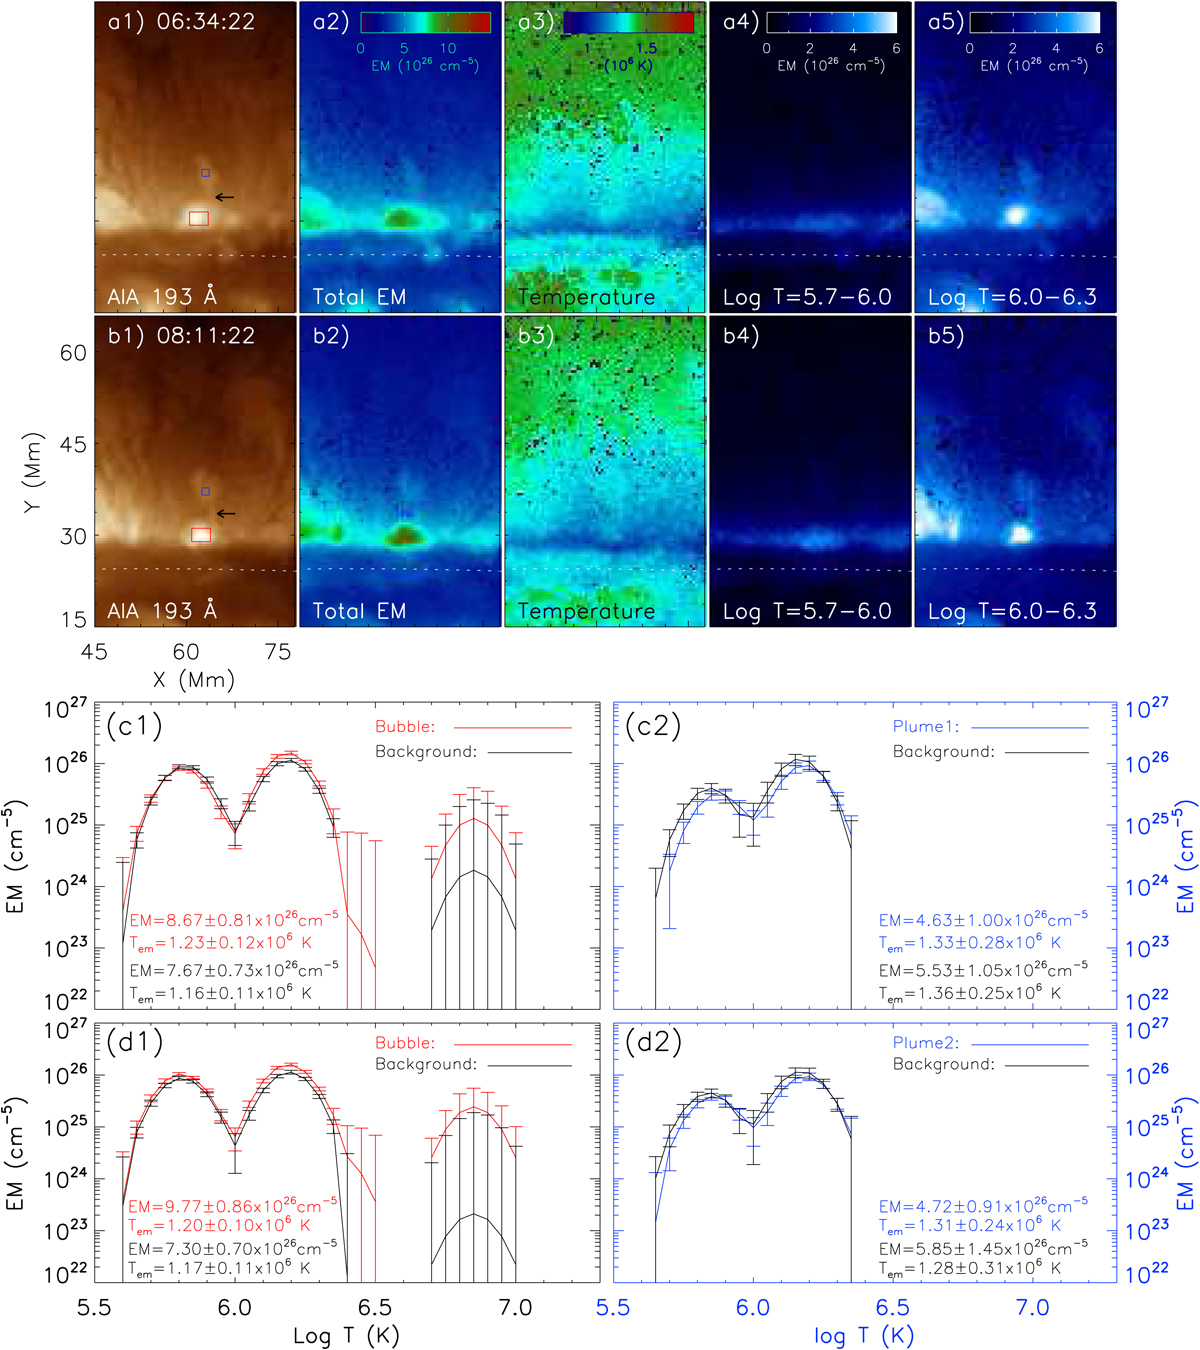
Download original image
Thermal characteristics in two large plumes. a1–a5: 193 Å image, total emission measures, EM average temperature, emission measures at log T = 6.0 − 6.3, and emission measures at log T = 6.0 − 6.3 at 06:34:22 UT. b1–b5: same as panels a1–a5 at 08:11:22 UT. c1 and c2: average EM curves in the red and blue boxes of panel a1 for the first large plume. d1 and d2: average EM curves in the red and blue boxes of panel b1 for the second large plume. The corresponding background EM curves are derived from the corresponding quiet Sun away from the prominence (red and blue boxes in Fig. 1a). The uncertainties were estimated using the Monte-Carlo experiment.
Current usage metrics show cumulative count of Article Views (full-text article views including HTML views, PDF and ePub downloads, according to the available data) and Abstracts Views on Vision4Press platform.
Data correspond to usage on the plateform after 2015. The current usage metrics is available 48-96 hours after online publication and is updated daily on week days.
Initial download of the metrics may take a while.