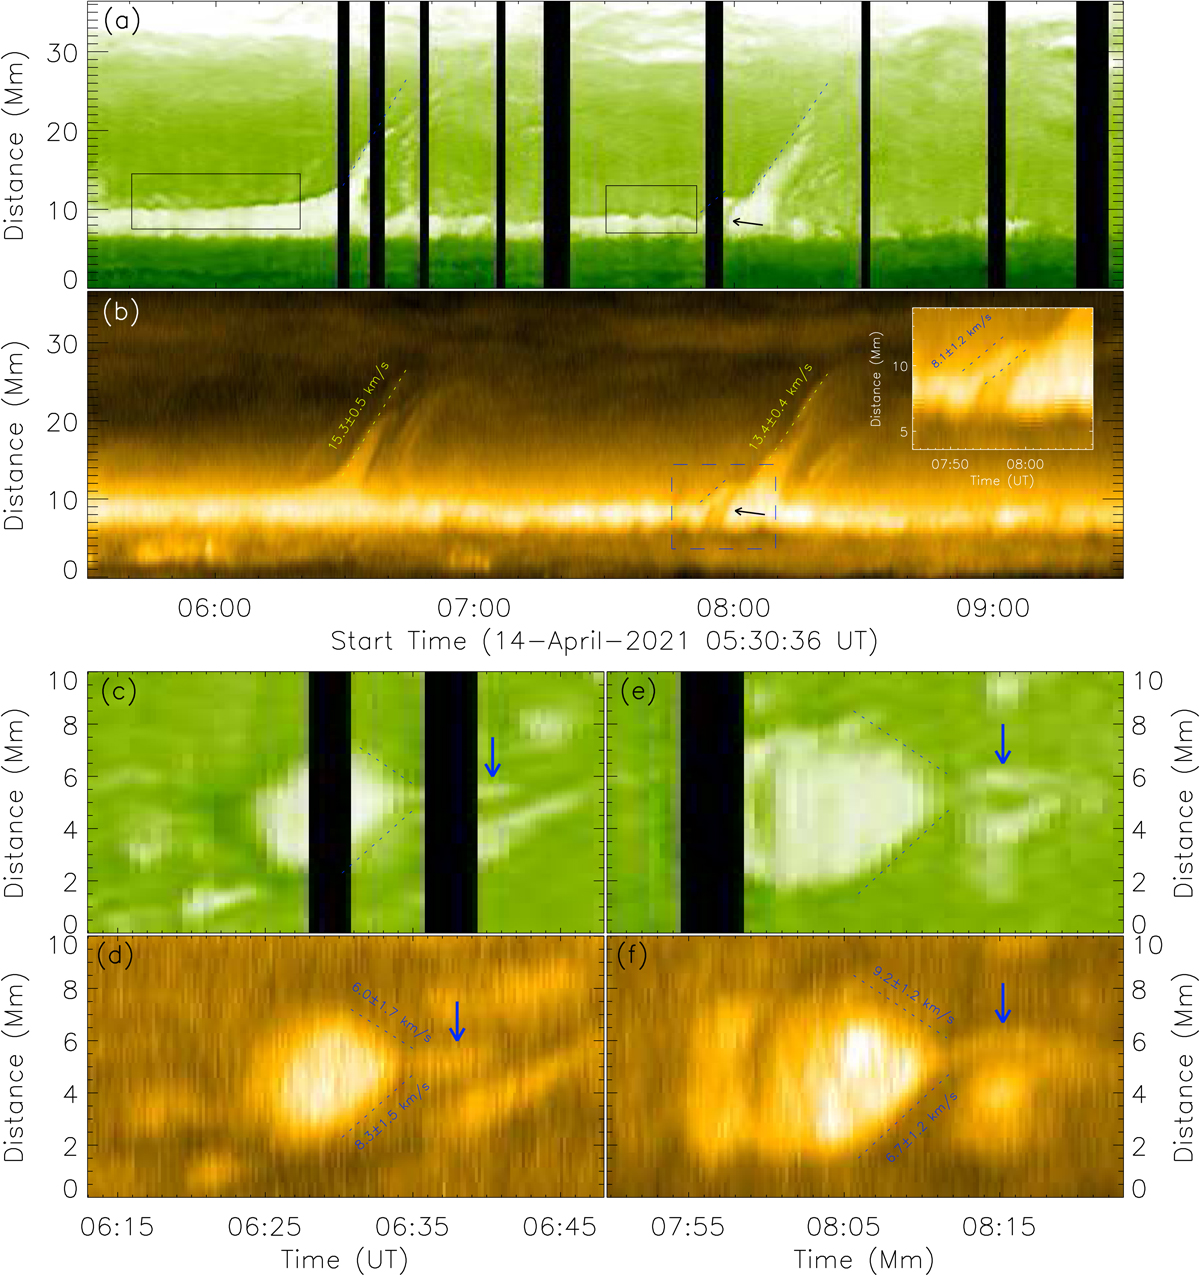
Fig. 4.
Download original image
Time–distance diagrams derived by a sequence of images. a: NVST time–distance diagram along white dashed lines in Figs. 2a3 and 3a4. b: corresponding SDO/AIA 171 Å time–distance diagram. The inset time–distance diagram in the top right is a zoomed-in image of the region marked by the blue dashed box. c and d: time–distance diagram derived by NVST Hα and SDO/AIA 171 Å images along the black line in Fig. 2b3. e and f: time–distance diagram derived by NVST Hα and SDO/AIA 171 Å images along the black line in Fig. 3b4. The uncertainties on the velocities are estimated as the error in the length measurement which is considered to be about 0.6 arcsec (about one pixel length of SDO/AIA).
Current usage metrics show cumulative count of Article Views (full-text article views including HTML views, PDF and ePub downloads, according to the available data) and Abstracts Views on Vision4Press platform.
Data correspond to usage on the plateform after 2015. The current usage metrics is available 48-96 hours after online publication and is updated daily on week days.
Initial download of the metrics may take a while.