Fig. 3.
Download original image
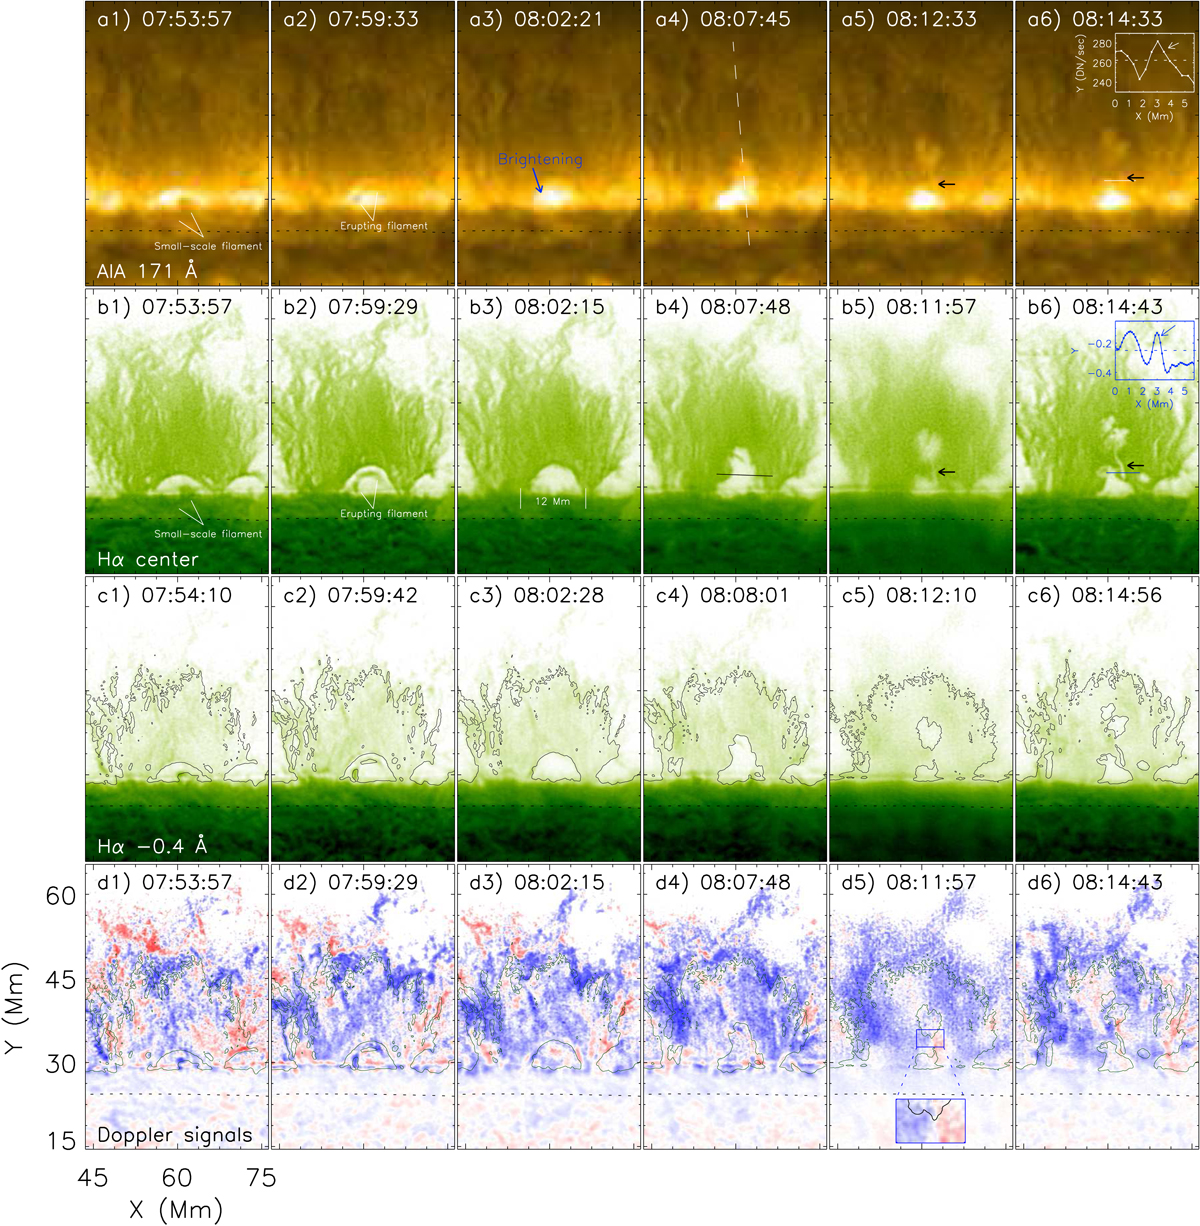
Evolution of the second large plume. a1–a6: SDO/AIA 171 Å observations. The white dashed line in panel a4 marks the position of the time–distance diagrams in Figs. 4a–d. The white curve in panel a6 depicts the variation in normalized intensity of SDO/AIA 171 Å along the white line in panel a6. b1–b6: NVST Hα center observations. The black line in panel b4 marks the slit position of the time–distance diagram in Fig. 4f. The blue curve in panel b6 depicts the variation of normalized intensity of inverse Hα center along the blue line in panel b6. c1–c6: NVST Hα blue wing (−0.4 Å) observations. d1–d6: corresponding Doppler signals. The contours in panels c1–c6 and d1–d6 outline the corresponding inverse Hα center with a level of 0.25 of the normal intensity. The black horizontal arrows mark the slender void thread in panels a5, a6 and b5, b6.
Current usage metrics show cumulative count of Article Views (full-text article views including HTML views, PDF and ePub downloads, according to the available data) and Abstracts Views on Vision4Press platform.
Data correspond to usage on the plateform after 2015. The current usage metrics is available 48-96 hours after online publication and is updated daily on week days.
Initial download of the metrics may take a while.