Free Access
Fig. 8
Download original image
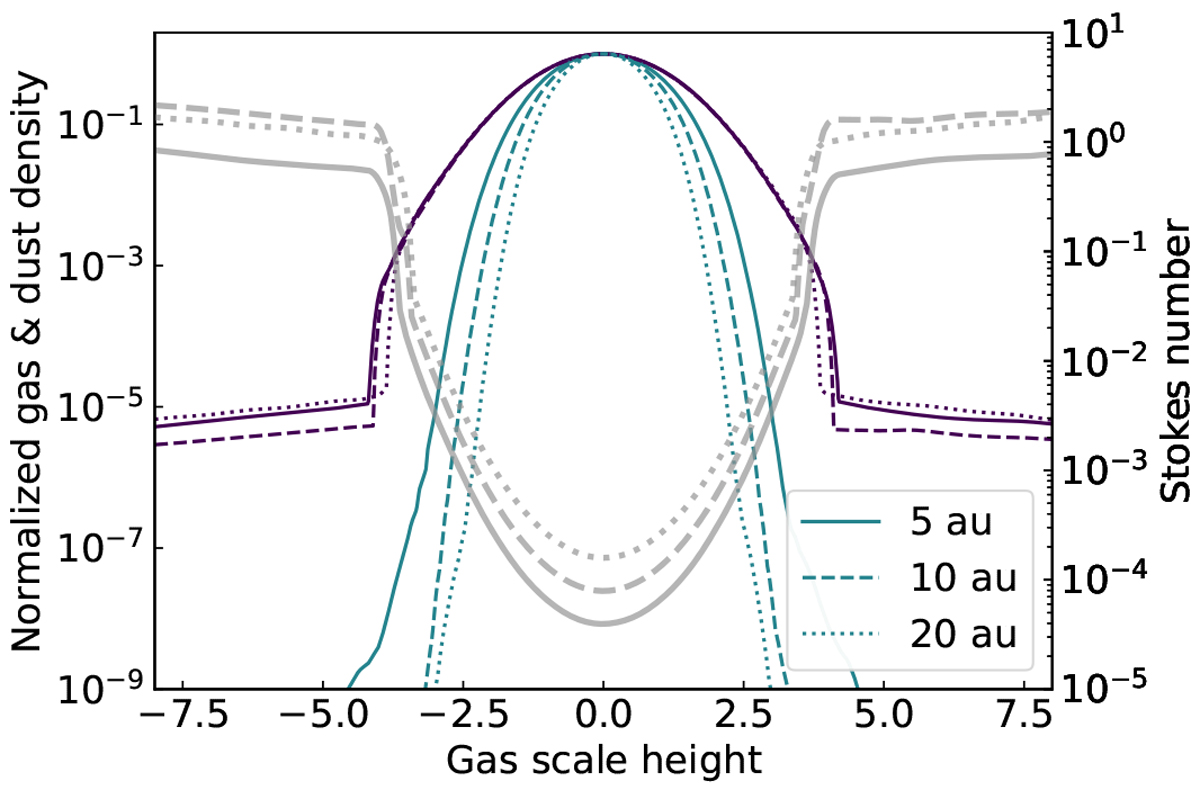
Normalized vertical density slices of the phc2 at different radial locations in the disk. The violet lines represent the normalized gas density while the turquoise lines display the dust density of 10 μm grains. The gray lines denote the respective Stokes number profile.
Current usage metrics show cumulative count of Article Views (full-text article views including HTML views, PDF and ePub downloads, according to the available data) and Abstracts Views on Vision4Press platform.
Data correspond to usage on the plateform after 2015. The current usage metrics is available 48-96 hours after online publication and is updated daily on week days.
Initial download of the metrics may take a while.