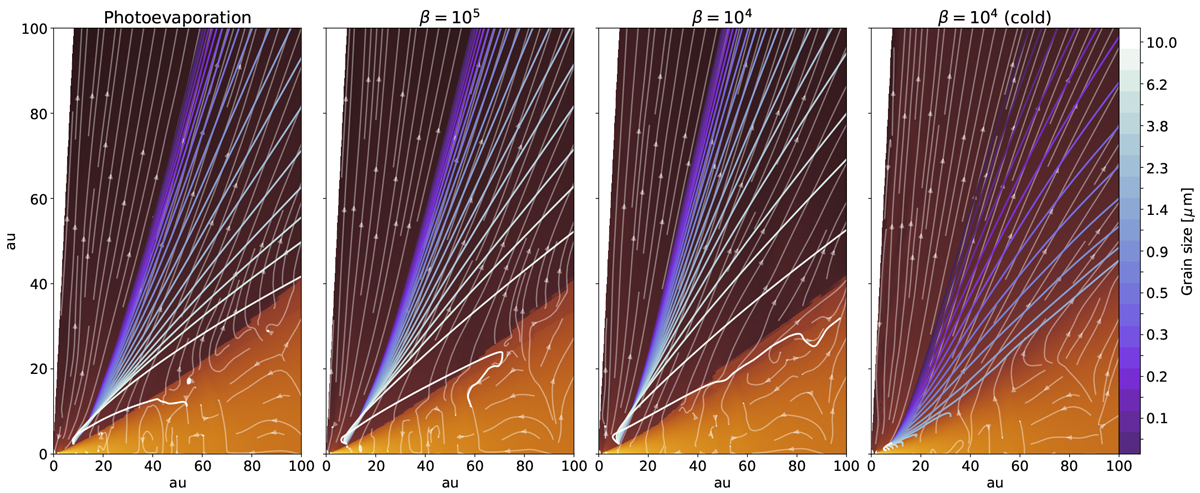
Fig. 6
Download original image
Numerically integrated dust trajectories for snapshots after 500 T0 of the simulation runs phc2, b5c2 and b4c2. The orange color map represents the gas density and the thin arrowed white lines denote the gas velocity streamlines. The thicker colored lines visualize the dust trajectories for grain sizes ranging from 0.1 μm to 10 μm.
Current usage metrics show cumulative count of Article Views (full-text article views including HTML views, PDF and ePub downloads, according to the available data) and Abstracts Views on Vision4Press platform.
Data correspond to usage on the plateform after 2015. The current usage metrics is available 48-96 hours after online publication and is updated daily on week days.
Initial download of the metrics may take a while.