Fig. 5
Download original image
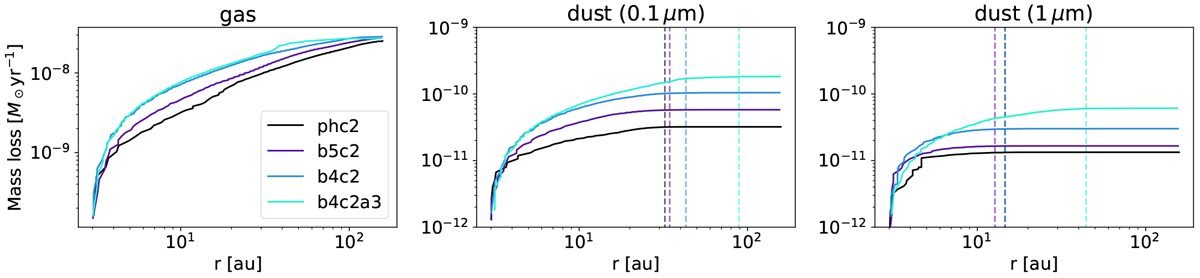
Cumulative mass loss rates of gas and dust for the simulation runs phc2, b5c2, b4c2 and b4c2a3 starting from 3 au. The cylindrical radius or foot point of the loss is obtained by tracing backwards the corresponding streamline from the outer radial boundary down to 5 scale heights above the disk mid plane. The flow field is averaged over 50 orbits at 1 au starting at 600 orbits. The vertical dashed lines mark the limit of the region where 99% of the mass loss occurred.
Current usage metrics show cumulative count of Article Views (full-text article views including HTML views, PDF and ePub downloads, according to the available data) and Abstracts Views on Vision4Press platform.
Data correspond to usage on the plateform after 2015. The current usage metrics is available 48-96 hours after online publication and is updated daily on week days.
Initial download of the metrics may take a while.